There's not much point in applying all the wonderful tips you learn reading PF blogs if you end up a millionaire but die at 50!. Aside from the obvious health tips - don't smoke, drink in moderation, drive carefully, avoid high-risk activities (unsafe sex, drug use, freestyle rock climbing, cave scuba diving etc.) the most important keys to living long (and healthy) enough to enjoy your wealth are getting enough exercise and maintaining a healthy body weight/BMI.
Personally I'm overweight and need to modify my diet to a more healthy one so I can get down to my ideal BMI in a healthy way (no crash dieting!) and then maintain it for the rest of my life. I've read up a bit on CRAN (calorie restriction with adequate nutrition) which basically means reducing the amount of calories you eat while watching out that you are still getting the optimal amounts of vitamins, protein, fat (yes, some IS needed) and carbohydrates. Up to now CRAN has been mostly theoretical, based on observations and experiments with short life-span animals. This research showed that when a test animal's diet was restricted to about 25%-40% less calories than would be eaten in a totally "unrestricted" diet, the average life-span was extended (up to 50%) and a more healthy old age resulted (although there's not much evidence that it increases the maximum possible life-span).
It now appears that longer-term experiments with longer-lived species that are more similar to ourselves are providing more evidence that CRAN is likely to be beneficial to humans wanting to live longer and healthier life-spans. See this article for a very interesting update that shows the very positive effects of CRAN on monkeys.
Personally, applying CRAN means reducing my average daily calorie intake from around 3,200 kcals down to a healthy 2,000 kcals by eliminating junk foods - I tend to snack on icecreams, sweets, chocolate, biscuits etc. which are all totally unnecessary (and expensive!). I'm hoping to reduce my BMI from 31.5 (100 kg) down to 22.1 (70 kg) by the middle of next year. I think I'll add this goal as another bar graph in my blog to help track my progress!
Tuesday, 31 October 2006
Monday, 30 October 2006
Tax time blues - Part 2
Well, the Australian tax year runs from 1st July - 30th June, and the deadline for returns is 31st October. Way back on 14th August I wrote "Hopefully now that I've started using Quicken 2006 I'll be able to add in all the info for my current holdings over the next few months." - well, it never happened. What, with the birth of our second child in September, some uni assignments and doing too much blogging (!) I've never spent the time needed to enter all my expenses since 1 July as planned. What's worse is that I haven't brought my old share records in Quicken up to date, so I'm left with wading through my margin loan account statements to see what has been sold during the financial year, and then going through old records to work out the cost base.
Hopefully I'll get it all sorted out tonight and fill in the electronic eTax forms tomorrow so I can lodge it on time. As I'm owed a refund (I think) there probably wouldn't be a penalty for late lodgement, but I really want to get it over and done with. My new financial year's resolution is still to enter all my expenses into Quicken this year, and get my share records in Quicken up to date... we'll see how it goes.
tax
Blog Monetization: Generating a Disclosure Policy
An important part monetization of a blog is to disclose to what degree your posts may be influenced by sponsorship. By disclosing the purpose of my blog, and to what extent I include sponsored content, and how it is tagged as such, I'm letting readers know more about the information they'll be reviewing. I retain the freedom to write original content, as well as select the advertisers I choose to post about in exchange for payment.
DisclosurePolicy.org has a nice Disclosure Policy Generator to help generate your customised policy. It takes only a few moments to answer a few questions, and the result is a disclosure policy, such as mine below:
This policy is valid from 30 October 2006
This blog is a personal blog written and edited by me. For questions about this blog, please contact enoughwealth@yahoo.com.
This blog accepts forms of cash advertising, sponsorship, paid insertions or other forms of compensation.
This blog abides by the WOMMA Word of Mouth Marketing Ethics Code. We believe in honesty of relationship, opinion and identity. The compensation received may influence the advertising content, topics or posts made in this blog. That content, advertising space or post will be clearly identified as paid or sponsored content.
The owner(s) of this blog is compensated to provide opinion on products, services, websites and various other topics. Even though the owner(s) of this blog receives compensation for our posts or advertisements, we always give our honest opinions, findings, beliefs, or experiences on those topics or products. The views and opinions expressed on this blog are purely the bloggers' own. Any product claim, statistic, quote or other representation about a product or service should be verified with the manufacturer, provider or party in question.
This blog does contain content which might present a conflict of interest. This content may not always be identified.
To get your own policy, go to http://www.disclosurepolicy.org
PayPerPost
Money Myths: #1 - Money can't buy you happiness
Money can't buy everything, but there are lots of things that can be bought and which will increase your "happiness" level - for example, shelter, food, clothing, education and healthcare. Money is a tool, and it can be used to maximise happiness by spending on the things that are important to you. For example, if your kids getting a good education is important to you, you will be happier knowing that you are regularly saving in a college education fund, than you would be without. Similarly, if you want to provide for your family if anything happens to you, paying for life and disability insurance and having an emergency fund put aside will increase your level of happiness. And many people are happy to be able to afford charitable giving to those less fortunate than themselves.
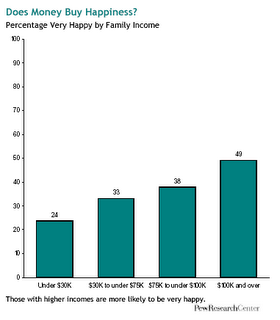
When people say "money can't buy you happiness" they are generally thinking of people who are unhappy despite being "rich" - but they often forget that their current level of contentment relies on having sufficient money to satisfy their basic needs and some of their aspirations. A recent report issued by the
Pew Research Center found that of those surveyed 49 percent of repsondents with an annual family income of more than $100,000 said they were happy, while only 24 percent of respondents with an annual family income of less than $30,000 reported that they were happy. (The findings are drawn from a telephone survey of a nationally representative, randomly-selected sample of 3,014 adults, conducted from Oct. 5 through Nov. 6, 2005.)
Once you have enough income to take care of basic needs, any excess can be used to maximize your happiness. But in order to do this, you have to know what's important to you, and set some realistic goals. It's often best to put these goals down on paper, with dollar amounts required to achieve them, and a realistic time-frame. If you put down some milestones along the way, so much the better.
investing, money, wealth
When people say "money can't buy you happiness" they are generally thinking of people who are unhappy despite being "rich" - but they often forget that their current level of contentment relies on having sufficient money to satisfy their basic needs and some of their aspirations. A recent report issued by the
Pew Research Center found that of those surveyed 49 percent of repsondents with an annual family income of more than $100,000 said they were happy, while only 24 percent of respondents with an annual family income of less than $30,000 reported that they were happy. (The findings are drawn from a telephone survey of a nationally representative, randomly-selected sample of 3,014 adults, conducted from Oct. 5 through Nov. 6, 2005.)

Once you have enough income to take care of basic needs, any excess can be used to maximize your happiness. But in order to do this, you have to know what's important to you, and set some realistic goals. It's often best to put these goals down on paper, with dollar amounts required to achieve them, and a realistic time-frame. If you put down some milestones along the way, so much the better.
investing, money, wealth
Sunday, 29 October 2006
How to succeed with your budget!
The mechanics of creating a budget are well-known, and, while not very enjoyable for many people, not hard to complete. The difficulty lies in implementing and sticking to your budget. You can greatly increase your chance of sticking with your budget if you give careful thought to the CHANGES that need to be made to get from your old budget (starting position) and the new budget you hope to implement. Each change should be classified as either a ELIMINATION or a SUBSTITUTION.
An elimination is when you have to totally get rid of a particular spending behaviour - for example, quitting smoking or cutting up your credit card. These changes are very hard, and should only be done if absolutely necessary. A lot of changes SHOULD be classified as a substitution - for example, drinking filtered tap water and tea rather than softdrinks and Starbucks. These are usually much easier to implement as you are not having to eliminate a behaviour pattern 'cold turkey', but are still able to follow your normal routine with minor changes. Generally, after a week of substitution it will become a habit and can be followed without any further effort of will needed.
Many people make the mistake of classifying intended changes as an elimination when they should be aiming for a substitution instead. For example, if you wish to save on entertainment costs, it is far better to substitute your cable TV subscription with borrowing DVDs and books from your local library, substituting gym membership with lunchtime walks and so on. Trying to eliminate spending without introducing a suitable alterative will leave you in a permanent state of "deprivation" and you are more likely to fall back into old spending habits.
money, saving
Update: Blog Monetization
Well, so far my traffic is slowly building, but not enough to generate any significant revenue via ad clicks. However, the PayPerPost experiment is going quite well so far - I haven't met the 30 day requirement to actually get paid for any of the sponsored posts so far (first payment due in 16 days, fingers crossed), but there have been enough "opportunities" that were relevant to personal finance and I felt happy to blog about.
So far I have had a total of $30.00 "credit" for 5 posts - 3 approved ($21.00) and 2 still pending the OK. Generally it takes a few business days to get a new post approved.
If anyone would like to give PPP a try, you can use me as a referrer (enoughwealth@yahoo.com) when you sign up, and I'll get a $5.00 referral bonus!
I'll let you know when the first actual payment hits my Paypal account.
PayPerPost
Six Things I Really Hate About PF
The six things I find most annoying in the realm of Personal Finance*:
1. Paying high fees and trailing commisions for mutual funds and insurance. The commision paid out of your first year's insurance premium is especially high (like up to 50%). And it seems that you generally can't even avoid such fees by buying "direct" from a fund or insurer.
2. That the "standard" fee structure for exotic investments such as Art Funds and Hedge Funds is 2/20 (2% MER plus 20% of any "surplus" performance, say above 6%) - since when does achieving a return of 7% justify a fee of 2.2%?
3. Mutual funds closing down when they perform badly for a few years (so that they can "bury" the bad performance figures). Often I'd like to have kept the investment open, and wait for an expected turn-around in the long-term (example: asian funds during the asian meltdown)
4. Small companies that need additional finance not giving their existing shareholders the opportunity to kick in more funds and retain ownership. eg. the company goes into administration/bankruptcy, sells out to a private investor for almost nothing, or accepts funding from a private investment company at an exhorbitant interest rate (often the interest is capitalised and eventually is paid out via a large issue of new shares to the investment company, which dilutes the existing shareholders stake tremendously).
5. Upper management costs - I've read that up to 10% of the profit of listed companies is spent on remuneration for the top 5 staff! I've nothing against reasonable payments, but there're too many examples of CEOs getting paid huge sums for mediocre performance, and then getting massive "golden handshakes" to terminate their contract "early". And don't get me started on payment of performance bonuses when a company is doing badly.
6. That 90% of what you read and see in the media about money and investments is absolute gibberish - and 90% of the audience has no idea.
* I haven't counted annoying things that were my own stupid fault, or just bad luck, such as investing in a stock that has lost money.
Frugal living: photography is a low-cost hobby!
Wow, it's amazing how the "electronic age" has made some hobbies a LOT cheaper to indulge. For example, I bought my first SLR camera kit in the early 80s. Although the cost of the Pentax MX SLR and lenses was quite high, the real expense of this hobby was film and developing, not the mention negative slides, slide mounts, photo albumns etc. Although I enjoyed taking photos on holiday (after all, ten years after an overseas trip, the only thing you really have to show for spending thousands is a collection of photos and/or video) it was a bit too expensive to "practice" photography and experiment.
This has totally changed since digital cameras came out, and, especially now I have a digital Pentax *ist DL SLR (it may not be the best digital SLR, but it can be used with my existing collection of lenses and my telescope adaptor), I can take LOTS of photos, and it costs me practically nothing. In fact, being able to email pics to my relatives means that I'm saving money compared to having to get duplicate prints to mail.
It's also nice to be able to grab the digital SLR and take some quick pics and immediately see what they look like. For example, a frilly lizard has taken up residence in our yard, and is quite photogenic:

saving
Saturday, 28 October 2006
AU shares: T3 share float
No, it's not the Terminator. Here in Oz the big investment buzz at the moment is regarding the goverment sell-off of their controlling stake in our telecom monolith - Telstra. They'd previously sold off chucks in the "T1" and "T2" offers several years ago. Unfortunately, T2 was sold at the peak of the dot.com bubble, so all the "mum and dad" investors who had made money buying T1 (at $3.30 a share in 1997), then lost a bundle buying T2 (at $7.40 a share) - unless they managed to sell at the peak of around $8.00. With Telstra currently around $3.65 a share, it'll be interesting to see how sucessful the T3 float is. The government isn't selling off it's entire remaining 51.8% stake in T3 - the base offer is 2.15 billion Telstra shares, or one-third of the Government's remaining 51.8 per cent stake, with the remainder to be dumped in the Future Fund (setup to eventually pay for unfunded public service pensions).
I bought T1, and then skipped T2 (I'd read enough about Dutch Tulips to avoid the dot.com frenzy). I've now applied for $10,000 worth of T3 shares. The first installment will cost $2 per share, with the remainder (based on the institutional book-build price, minus a 10c per share retail discount, plus a 1 per 25 bonus share issue when the 2nd installment is paid...) due in 18 months time. Telstra is currently paying a large dividend, so the ROI on the initial $2 installment is around 14% pa (plus tax credits due to dividend imputation). With the 10c discount and bonus share issue, the final cost of T3 shares should be around $3.25-$3.50 a share, although the final price won't be known until after a three-day institutional book-build set down for November 15 to 17.
Telstra is currently rapidly losing revenue as customers abandon the old landline phones in favour of mobile phones, and the mobile phone business is highly competitive. Whether T3 is a "cheap" buy at even $3.25 a share will all depend on how Telstra's cost cutting program works out, and how well they funnel cash flow into new business areas.
ps. It's interesting to read some of the misinformation that gets printed in the mainstream press - The Australian newspaper (one of our major national papers) printed on 10 Oct that T3 retail customers "will receive loyalty shares - a bonus issue of 25 shares for each 100 shares they retain". A pity that the propectus actually states that the loyalty share issue is 1 share for each 25 shares retained until then final installment is paid. Just a little difference of a 4% discount vs. a 25% discount! ;)
stocks
Frugal living: Comparison shopping
Online shoppers are increasingly using comparison shopping engines (CSEs) to compare the offerings of many merchants side by side in order to obtain the best possible price. Indeed, its been reported that between 25% and 75% of online purchases are influenced by comparison shopping.
For shoppers, websites such as www.buyfast.com.au and www.planetonline.com allow you to easily compare prices available for particular items. For online retail companies, software such as ShopTracker can be used to build, manage, categorize, and optimize products within shopping feeds at comparison shopping engines.
Using extremely comprehensive search engines, online comparison shopping sites allow shoppers to research and make purchasing decisions using information such as product descriptions, reviews, total price and product availability. Tools such as ShopTracker allow retailers to optimize product placement within the CSE's. For instance, the retailer can check if he/she is setting prices too high, effectively removing their products from the first page of results, or if the products are under priced compared to competitors, costing them revenue.
Basically, online shopping allows consumers to find a vast selection of merchandise and use the internet to find the lowest prices by searching multiple Websites and comparing offers. However, as more and more retailers have come online the amount of information, products and choices has become overwhelming. This has driven the next evolution of online shopping - online comparison shopping, and the growth of retailer tools such as ShopTracker.
Sponsored Post
Friday, 27 October 2006
Frugal living: Watch out for shopping trolley junk
While clipping petrol discount coupons off my "weekly" shopping dockets I decided to analyze my spending based on the dockets sitting in my wallet. Generally I just put the total amounts into Quicken, and track the total spent on "groceries" against my budget. But I realised that this doesn't really tell me WHAT I'm spending my grocery shopping budget on. I knew that I buy the odd snack/junk food or drink items, but I was shocked to find out exactly how much money I was wasting on these items:
The first thing that jumps out is that I'm shopping way too often (I tend to drop in to the supermarket nearly every second day while I'm collecting my mail from my post office box - this is NOT a good habit. I really should stick to one major shopping trip each week, and only get items that are on my shopping list).
The second thing is that spending 28% of the total on junk foods and drinks is ridiculous! I'm the one in our household that eats and drinks most of this junk, so I've no reason not to just eliminate this completely. This would save me around $2,500 a year AND be much better for my health. I think I'll add a new target to my blog - spend less than 5% of my grocery shopping on snack/junk food and drink.
money, saving
Analysis of my last 8 shopping dockets:
Total spend            $351.86
Avg. spend per trip    $ 43.98

Category                     Amount  % of total
Household cleaning/laundry   $20.07    5.70 %
Basic foodstuffs            $190.06   54.02 %
Snack/Junk foods             $50.78   14.43 %
Snack/Junk beverages         $48.74   13.85 %
Medicines                    $10.82    3.08 %
Baby care                    $29.10    8.27 %
Toys/gifts                    $2.29    0.65 %
The first thing that jumps out is that I'm shopping way too often (I tend to drop in to the supermarket nearly every second day while I'm collecting my mail from my post office box - this is NOT a good habit. I really should stick to one major shopping trip each week, and only get items that are on my shopping list).Total spend $351.86
Avg. spend per trip $ 43.98
Category Amount % of total
Household cleaning/laundry $20.07 5.70 %
Basic foodstuffs $190.06 54.02 %
Snack/Junk foods $50.78 14.43 %
Snack/Junk beverages $48.74 13.85 %
Medicines $10.82 3.08 %
Baby care $29.10 8.27 %
Toys/gifts $2.29 0.65 %
The second thing is that spending 28% of the total on junk foods and drinks is ridiculous! I'm the one in our household that eats and drinks most of this junk, so I've no reason not to just eliminate this completely. This would save me around $2,500 a year AND be much better for my health. I think I'll add a new target to my blog - spend less than 5% of my grocery shopping on snack/junk food and drink.
money, saving
Frugal living: free "safe deposit" box
Keepyousafe.com has a great idea - users get a free small-sized Online Safe Deposit Box for one year, and can upgrade to a larger permanent box for as little as $3 per month. The key requirement for using online storage of your valuable records is that your stuff is "truly secure" as they say.
So far, their web site appears to still be in test mode - their "recent news" says:
And when you go to the FAQ page you get the following security warning:

which isn't critical, but would be off-putting to many potential customers.
Also, the FAQ itself consists simply of a message to "Please email support@keepyousafe.com for customer support."
I'll sign up for a free "small-sized" Online Safe Deposit Box to check out the service with some non-critical documents. It will be interesting to see how this service develops over the next few months.
PayPerPost
So far, their web site appears to still be in test mode - their "recent news" says:
Final testing of our Secure Online Safe Deposit Box has now been
successfully completed. Please re-visit us in the next two weeks as
new content is introduced on the site and press announcements are added.
successfully completed. Please re-visit us in the next two weeks as
new content is introduced on the site and press announcements are added.
And when you go to the FAQ page you get the following security warning:

which isn't critical, but would be off-putting to many potential customers.
Also, the FAQ itself consists simply of a message to "Please email support@keepyousafe.com for customer support."
I'll sign up for a free "small-sized" Online Safe Deposit Box to check out the service with some non-critical documents. It will be interesting to see how this service develops over the next few months.
PayPerPost
Income: Is higher education a good investment?
One of the fundamental tenants of wealth creation has always been to invest in your education. Latest figures (released Thursday by theUS Census Bureau) confirm this. The figures show that the average bachelor's degree is worth about $23,000 a year - that is the average gap in earnings between adults with bachelor's degrees and those with high school diplomas. College graduates made an average of $51,554 in 2004, compared with $28,645 for adults with a high school diploma, an average of $19,169 for those without a highschool diploma, and an average of $78,093 for those with an advanced college degree.
Of course, this study didn't determine how much of the increased earning power is due to having the intelligence to obtain the qualification, and how much is due to the education/qualification/networking of getting the further education.
The potential effect on your net worth is even greater than the raw salary figures suggest. There is a fixed "overhead" cost of living, so, assuming that you can exert some self-control and limit your spending as your salary increases, an increase in salary has a great effect on your ability to accumulate wealth. For example, if your basic cost of living is $30K pa, then a 50% pay rise from $40K to $60K has the potential to triple your ultimate net worth (saving and investing $30K rather than $10K pa).
personal finance, money, wealth
Blog Monetization: Building Traffic
James Brausch has some interesting tips on how to build up blog traffic at his Internet business site. One of the more interesting articles is "Why Article Marketing Is My #1 Traffic Strategy" - where he outlines how to build traffic by writing an article, and, by mixing and matching several different versions (swapping variations of the same paragraph) you can generate hundreds of "unique" content articles for submission. Unfortunately he doesn't provide much info on where to submit your articles - for that you'd have to buy he software "Artemis Pro" for $105! As I can easily write a macro in excel to mix 'n match article paragraphs to create "unique" content, it's just a question of how much time it would take to manually track down article submission sites and manually submit my articles. I'll do a bit of research on this and see if it's worth spending the $105. I suppose it all depends on how monetized your site is, and whether the increased traffic justifies the cost.
PayPerPost
PayPerPost
Thursday, 26 October 2006
Medical Expenses
I had to see the doctor twice last week. The first "long" consultation (about 20 mins) cost $80, and the follow-up visit (a "short" consultation of around 10 mins) cost $50. Because I'd registered my banking details with the practice, my Medicare rebate was paid electronically into my bank account the next business day after I'd paid each bill using my day-to-day credit card. I got $59.70 refund from Medicare for the long consult, and $31.45 back for the short consult - overall a refund of 70% of the total doctor's bill. It's nice to get some of my tax dollars back, but I'd rather not be sick in the first place! The presciption medications cost me a total of $88.50 - each item costing just the $29.50 PBS (Pharmaceutical Benefits Scheme) subsidised price. I'm not sure how much it each item actually costs the government, but I'm sure it's well over twice the PBS price.
Ending up around $130 out-of-pocket for half an hour of a GPs time and several hundred dollars worth of medicine seems like a bargain. While I can see that this would still be a large cost for a "working poor" family, I believe some small co-payment should be required from all patients - say, $5 from the bulk-billed patients for each visit to the doctor. Most doctor's still "bulk-bill" pensioner patients, in which case the patient pays nothing, and the doctor gets a slightly reduced amount from medicare. A small co-payment would discourage overservicing - such as lonely pensioners visiting the doctor just for a chat!
Ending up around $130 out-of-pocket for half an hour of a GPs time and several hundred dollars worth of medicine seems like a bargain. While I can see that this would still be a large cost for a "working poor" family, I believe some small co-payment should be required from all patients - say, $5 from the bulk-billed patients for each visit to the doctor. Most doctor's still "bulk-bill" pensioner patients, in which case the patient pays nothing, and the doctor gets a slightly reduced amount from medicare. A small co-payment would discourage overservicing - such as lonely pensioners visiting the doctor just for a chat!
Gearing: Risk vs. Reward - the last 10 years
Using gearing to increase your returns in the long term has a couple of problems:
1) The interest rate charged directly impacts on the extra return generated
2) The extra risk (volatility) generated by gearing is large compared to the extra return
To get a better feel for how good a strategy gearing is, I've first looked at the current interest rates available for margin loans (and how it depends on the amount borrowed) and the current spread between the margin lending interest rate and the target cash rate set by the reserve bank.

The graph shows that the interest rate charged on a margin loan varies considerably between the different margin lenders, so it pays to shop around. Generally, the interest rate is reduced for clients with a large loan balance, so it's probably worth having one large loan rather than spreading it between several lenders (this is something I need to fix over time, as I currently have three different margin loan accounts. The problem is the tax effect of realising capital gains when transferring holdings from one lender to another).
It can be seen that the current spread between the target cash rate (6.00%) and the typical margin loan interest rate on a $500,000 loan is about 2.5% - so I've assumed this was the typical spread during the past ten years or so.
I've then used the changes in the target cash rate over the past decade (see below) to calculate the average margin loan interest rate each year since 1997, and compared that to the change in the All Ordinaries Index each year:
This table confirms that the use of gearing would have boosted your returns during the past decade - from an average of 8.13% pa without gearing, to 8.62% using 100% debt:equity (a 50% loan:value ratio), and 9.11% using a higher gearing rate of 67% LVR (close to the normal lending limit of 70%).
However, it also clearly shows that the use of gearing greatly magnified the ups and downs of a portfolio - the relatively modest 11.47% drop during 2002 would have meant a 48.53% drop in value of a portfolio using 67% LVR, and probably would have required more cash being added into the account to avoid getting a margin call.
In the long term, getting a return of 9.11% instead of 8.13% will have a large effect on your final net worth - if inflation averaged 3% this would result in a real return of 6.11% rather than 5.13% (an improvement of 19%).
It is important to watch your LVR when using gearing, be conservative when the market is setting new highs, and be prepared to manage your portfolio to avoid any margin calls. It is also very important to shop around for the best possible interest rate - possibly using home equity to obtain lower rates.

personal finance, investing, investment, stocks
1) The interest rate charged directly impacts on the extra return generated
2) The extra risk (volatility) generated by gearing is large compared to the extra return
To get a better feel for how good a strategy gearing is, I've first looked at the current interest rates available for margin loans (and how it depends on the amount borrowed) and the current spread between the margin lending interest rate and the target cash rate set by the reserve bank.

The graph shows that the interest rate charged on a margin loan varies considerably between the different margin lenders, so it pays to shop around. Generally, the interest rate is reduced for clients with a large loan balance, so it's probably worth having one large loan rather than spreading it between several lenders (this is something I need to fix over time, as I currently have three different margin loan accounts. The problem is the tax effect of realising capital gains when transferring holdings from one lender to another).
It can be seen that the current spread between the target cash rate (6.00%) and the typical margin loan interest rate on a $500,000 loan is about 2.5% - so I've assumed this was the typical spread during the past ten years or so.
I've then used the changes in the target cash rate over the past decade (see below) to calculate the average margin loan interest rate each year since 1997, and compared that to the change in the All Ordinaries Index each year:
        Average                                                 ----with gearing----
Year    cash    ML      XAO     XAO     %       % gain  w/out   50% LVR   67% LVR
        rate    rate    start   end     change  or loss    ML   100% D:E  200% D:E
1997    5.48%   7.98%   2411.2  2609.1   8.21%   0.23%   8.21%   8.43%     8.66%
1998    4.98%   7.48%   2609.1  2832.6   8.57%   1.09%   8.57%   9.65%    10.74%
1999    4.79%   7.29%   2832.6  3124.1  10.29%   3.00%  10.29%  13.29%    16.29%
2000    5.93%   8.43%   3124.1  3205.4   2.60%  -5.83%   2.60%  -3.22%    -9.05%
2001    5.06%   7.56%   3205.4  3384.5   5.59%  -1.97%   5.59%   3.61%     1.64%
2002    4.56%   7.06%   3384.5  2996.2 -11.47% -18.53% -11.47% -30.00%   -48.53%
2003    4.81%   7.31%   2996.2  3309.8  10.47%   3.16%  10.47%  13.62%    16.78%
2004    5.25%   7.75%   3309.8  4060.7  22.69%  14.94%  22.69%  37.62%    52.56%
2005    5.46%   7.96%   4060.7  4721.1  16.26%   8.30%  16.26%  24.57%    32.87%
                                   AVG   8.13%   0.49%   8.13%   8.62%     9.11%
Average ----with gearing----
Year cash ML XAO XAO % % gain w/out 50% LVR 67% LVR
rate rate start end change or loss ML 100% D:E 200% D:E
1997 5.48% 7.98% 2411.2 2609.1 8.21% 0.23% 8.21% 8.43% 8.66%
1998 4.98% 7.48% 2609.1 2832.6 8.57% 1.09% 8.57% 9.65% 10.74%
1999 4.79% 7.29% 2832.6 3124.1 10.29% 3.00% 10.29% 13.29% 16.29%
2000 5.93% 8.43% 3124.1 3205.4 2.60% -5.83% 2.60% -3.22% -9.05%
2001 5.06% 7.56% 3205.4 3384.5 5.59% -1.97% 5.59% 3.61% 1.64%
2002 4.56% 7.06% 3384.5 2996.2 -11.47% -18.53% -11.47% -30.00% -48.53%
2003 4.81% 7.31% 2996.2 3309.8 10.47% 3.16% 10.47% 13.62% 16.78%
2004 5.25% 7.75% 3309.8 4060.7 22.69% 14.94% 22.69% 37.62% 52.56%
2005 5.46% 7.96% 4060.7 4721.1 16.26% 8.30% 16.26% 24.57% 32.87%
AVG 8.13% 0.49% 8.13% 8.62% 9.11%
This table confirms that the use of gearing would have boosted your returns during the past decade - from an average of 8.13% pa without gearing, to 8.62% using 100% debt:equity (a 50% loan:value ratio), and 9.11% using a higher gearing rate of 67% LVR (close to the normal lending limit of 70%).
However, it also clearly shows that the use of gearing greatly magnified the ups and downs of a portfolio - the relatively modest 11.47% drop during 2002 would have meant a 48.53% drop in value of a portfolio using 67% LVR, and probably would have required more cash being added into the account to avoid getting a margin call.
In the long term, getting a return of 9.11% instead of 8.13% will have a large effect on your final net worth - if inflation averaged 3% this would result in a real return of 6.11% rather than 5.13% (an improvement of 19%).
It is important to watch your LVR when using gearing, be conservative when the market is setting new highs, and be prepared to manage your portfolio to avoid any margin calls. It is also very important to shop around for the best possible interest rate - possibly using home equity to obtain lower rates.

personal finance, investing, investment, stocks
Wednesday, 25 October 2006
Frugal living: getting paid to exercise
I used to have a gym membership, but after the gym located on my route home from work closed down I didn't bother looking for another gym. I simply walked half an hour each lunchtime at work which saved me at least $10 a week in gym fees.
Later on I helped my son do a paper round before school/work. This involved a 2 hour walk (starting at 6am) 5 days a week, and earned my son around $95 a week - it's much better getting paid for exercising than having to pay a gym fee! I also found that I got more exercise that way, as we couldn't skip a session if I wasn't in the mood.
Also, because my son was earning an income, he was eligible to contribute $1,000 into his own retirement savings account (RSA) and receive a $1,500 superannuation co-contribution from the government. Hence the net benefit of getting paid to exercise was me saving $520 pa and my son adding $6,440 pa to his net worth.
I stopped doing the paper round just before the arrival of our second child last month - getting up a 5:30am doesn't fit in well with disturbed nights and dirty nappies! I'll now have to get back in to the routine of daily lunchtime walks, and swimming during the summer months. Later on we'll look for some weekend work delivering flyers to peoples letter boxes - because our local paper has to be delivered before school each day it's not a viable long term job for a school boy and his poor, old dad!
personal finance, money, retirement
Tuesday, 24 October 2006
If I was a rich man
I've always had a fascination with castles, knights and the whole medieval lifestyle thing. I'd love to buy a slightly run-down but livable manor house, and I even went so far as to tender an offer for a manor house in Scotland a few years ago - unfortunately although the advert in Country Life had said "offers over 150,000 pounds" (around AUD $375,000), it quickly became apparent that a realistic price was over 400,000 pounds. In the end my father and I made an offer of just under 400,000 pounds which wasn't accepted. I think the property sold for around 450,000 pounds or so - a bit out of my league. It's also a large chunk of capital to invest in an asset that doesn't tend to appreciate much over the inflation rate - although country houses in the UK have boomed in the past few years, boosted by price increases in the cities.
These days I still browse through the Country Life ads looking for a bargain, and I even look at properties in Eastern Europe and at buying a property in Spain - although I'd rather buy in the UK as I know the language and legal system. It gives me something to daydream about while waiting for the magic of compound interest to do it's work on my investment portfolio.
PayPerPost
Retirement Fund Asset Mix
I generally think a 40% domestic shares, 35% foreign shares, 15% property, 10% bonds is the basic starting point for working out a long-term investment mix, provided this weighting towards growth assets matches your risk tolerance. Since my retirement fund is definitely a long-term investment(20 years till retirement age, then maybe another 20 or so during retirement) this was my starting point. I did decrease my weighting in shares and increase the % in property during the bear market in 2001, and then weighted my asset mix more towards shares in 2003 when the market seemed to have bottomed out.
My current investment mix in my retirement account is as follows
Overall the asset allocation works out as:
The cash component isn't really intentional - it's just that all the stock funds tend to have a cash float at all times. I've got less in bonds than my "plan" requires - but with interest rates still quite low the risk of capital loss with bond investments seems more towards the upside, and the coupon rate is nothing too exciting. If interest rates here go up another 0.25% or .50% and the economy slows down, I'll reweight from stocks to bonds. I think my "model" retirement portfolio is around 40% AU shares:35% INT shares:15% LPT:10% bonds:0% cash
Hopefully these Asset classes should return something like the following in the long term:
This would give my "model" portfolio an expected return of around 8.65% (after fees and charges)
personal finance, investing, investment, stocks, real estate
My current investment mix in my retirement account is as follows
BT Business Superannuation
Investment Option                         wt %
Colonial First State Diversified         1.91%
Westpac Australian Shares               19.68%
Colonial First State Australian Shares  25.53%
Westpac International Shares             1.93%
BT Core Global Shares                   20.48%
MLC Global Share                        20.13%
Westpac Australian Property Securities  10.26%
Westpac Australian Fixed Interest        0.06%
Intech High Opportunity                  0.03%
Overall the asset allocation works out as:
Asset class                               wt %
Australian Shares                       43.52%
International Shares                    37.93%
Property                                10.13%
Bonds                                    0.38%
Cash                                     8.03%
The cash component isn't really intentional - it's just that all the stock funds tend to have a cash float at all times. I've got less in bonds than my "plan" requires - but with interest rates still quite low the risk of capital loss with bond investments seems more towards the upside, and the coupon rate is nothing too exciting. If interest rates here go up another 0.25% or .50% and the economy slows down, I'll reweight from stocks to bonds. I think my "model" retirement portfolio is around 40% AU shares:35% INT shares:15% LPT:10% bonds:0% cash
Hopefully these Asset classes should return something like the following in the long term:
Asset class                             return %
Australian Shares                        9.5%
International Shares                     9.0%
Property                                 8.0%
Bonds                                    5.0%
Cash                                     3.5%
This would give my "model" portfolio an expected return of around 8.65% (after fees and charges)
personal finance, investing, investment, stocks, real estate
Monday, 23 October 2006
Festival of Stocks - lots of great posts
The latest Festival of Stocks (#7) is now available at Gold Stock Bull. It has 11 great posts ranging for individual stocks such as Apple and Microsoft, Sectors like Australian banks, all the way up to how to capitalize on China’s growing consumerism.
Asset Class - Fine Art
The lack of correlation between the stock market and the art market makes Fine Art a possibly attractive asset class to use to diversify a portfolio beyond the traditional stocks, bonds and real estate. However, while art can hedge against some of the movements in the stock market, it has a similar level of risk and, for most individuals, it is too expensive to invest in individual art works. Even funds such as the popular London-based Fine Art Fund require investors to hand over a minimum of $250,000 in order to play the art market. And those investors will have to be willing to wait at least three years before they can cash out of their investment.
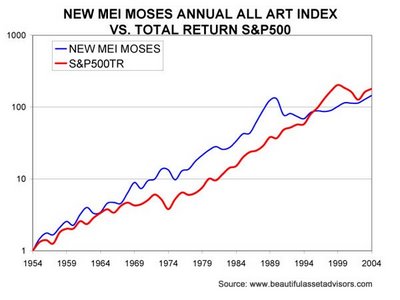
How has Fine Art performed as an asset class compared to, say, stocks? The Mei/Moses Fine Art Index, the creation of NYU Stern School of Business finance professors Jiangping Mei and Michael Moses, tracks 9,000 pieces of art that were auctioned by Sotheby's and Christie's since 1950. The index measures the value of the art market by analyzing repeat sales of the different pieces of art that comprise the index. While it is generally considered a fair benchmark for art valuation, it excludes transaction fees, works that fail to sell at auction and certain styles of art, such as photography and prints.
Over the last 50 years, stocks (as represented by the S&P 500) returned 10.9 percent annually, while the art index returned 10.5 percent per annum. As can be seen below, there is a low covariance between the Art Index and the S&P500 index:
One of the problems of consideraing Fine Art as an investment asset class is that in the art market, only about 30% to 50% of the works that change hands in any given year do so on the open market, at auction, where the public can see the prices. In the contemporary market, that figure plunges into the single digits. In addition, access to the market isn't always easy or cheap -- the supply of contemporary works is controlled by dealers, for instance, while hefty auction fees make it hard to compare the art market to any securities market. Therefore, the entry fee and management fees of any Art Fund are likely to be high - similar to that of Hedge Funds, but with performance that has historically been more in line with the stock market.
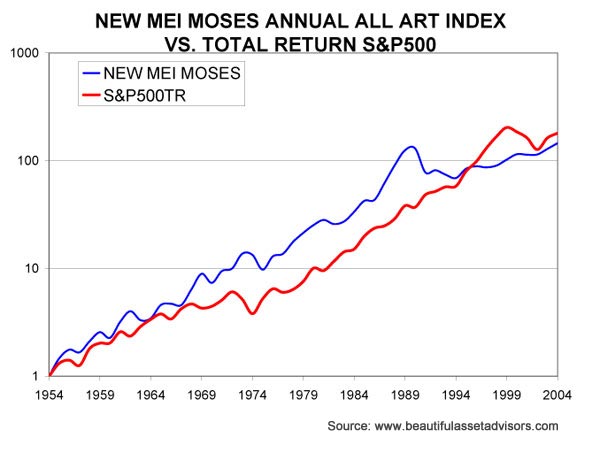
Sunday, 22 October 2006
Some thoughts about the use of gearing
How can you use gearing as part of your investment strategy? I hope to increase the returns of my portfolio with the least possible increase in risk by using borrowed funds to increase my investment. A simple example would be to invest a total of $200,000 in an index fund (eg. Vanguard) via a margin lending account, so that you've put in $100,000 of your own savings, and have borrowed the other $100,000 from the lender. The income from the $200,000 investment would cover part of the interest on the borrowed $100,000. Any extra I have to kick in from my cash flow to cover interest payments is tax deductible.
I prefer this approach (use of gearing) to that of boosting returns by including more risky assets in my portfolio because, theoretically, using gearing can provide more increase in return for an increased level of risk than just including a larger proportion of high-risk, high-return assets in your portfolio. Apparently it has something to do with the tangent of the line from the interest rate on the borrowed funds to the point on the efficient frontier corresponding to your asset mix having a steeper slope compared to just moving along the efficient frontier... Don't ask me to explain! As far as I can tell it looks something like the diagram below:

The idea is that you can increase the return of your "efficient" portfolio more by taking on extra risk through the use of gearing (ie. along the red line) than by changing the asset mix to include more risky assets (moving along the efficient frontier, assuming you have the right asset mix).
I don't worry too much about the details, as the entire concept of the efficient frontier seems fairly academic. In practice, you don't have precise data about all the assets in your portfolio (historic standard deviation, return, and covariance for all of the assets in your portfolio) or for determining the efficient frontier (such data on all possible assets mixes). Also, the usual problem of predicting the future using historic data applies. In practice, it seems that a sensible, well-diversified asset mix lies pretty close to the efficient frontier, and the use of gearing will be preferable to the inclusion of more risky assets in your portfolio (provided the interest rate on your investment loan isn't too high).
The other benefit of using gearing is that by having a larger total investment you are more able to make use of diversification.
Several things about the use of gearing (borrowing to invest) seem important to me:
1. You have to manage your risk - it is stupid (very risky) to borrow to invest in just one particular stock, or sector (eg. tech, oil, bio etc). I was amazed to learn that around 15% of margin loans are for accounts that have only one stock in them! The chances are you are not the next Warren Buffet (I know I'm not), so it's much more sensible to diversify - either via a portfolio of at least 10-12 stocks (not all in the same sector), or else via an index fund. Or a combination of both.
2. You have to borrow at the best possible interest rate - over time I've opened new margin lending accounts with lenders that offer a lower interest rate and that allow you to trade on your margin account via an online discount broker. Interest rates may be lower if you borrow a larger amount. I also have a margin lending account with the bank that provided my home and investment property loans - as a preferred customer I get 0.25% knocked of the standard interest rate. Most recently I used a "portfolio loan" secured against the equity in my real estate assets (similar to a HELOC?) to borrow at the standard home loan rate and invest in a portfolio of US shares (see my posts about my "Little Book" portfolio).
3. You should borrow less than the maximum so that you have a buffer against getting a margin call when the next market correction/bear market/crash happens. If the average margin for the stocks in your margin lending account is 70%, then you probably shouldn't get your loan-to-value ratio (LVR) above 50%.
The table below shows what % drop in the market would trigger a margin call for different starting values of gearing:
Gearing is basically the "muplitplier effect" that will apply to any losses or gains made by the portfolio on your equity. For example, if the gearing used is 2.0, then if your portfolio went up 10% your equity will have increased 20%. Similarly, if the market "corrected" -15% causing your portfolio to drop -15%, your equity will have gone down by -30%.
As the loan amount stays constant, any drop in the value of your portfolio will decrease the margin value (eg. 70% of the portfolio value). This also means that your margin utilisation increases. Most lenders will give you a "margin call" if your margin utilisation exceeds 100%. (There's often a "buffer" of 5%, so you'd get a margin call if the MU was >105%). When you get a margin call you have to bring your MU back down to less than 100%. This can be done in several ways:
* put some cash into your account (ie. pay off some of the loan) - this is best
* put in some stocks (eg. if you had some unencumbered stocks you could add into the margin account) - this is second best, as only the margin value of the stock (say, 70%) counts.
* sell off some stocks - you may not want to sell at the price prevailing when you get a margin call.
The most interesting column in the table is the % drop required to trigger a margin call. Looking at daily closing price data for the Australian All-Ordinaries Index (similar to the S&P500), I calculated the maximum % drop ever experienced after buying on any particular date for the past ten years. This period doesn't include any once-in-a-lifetime crash like '87 or '29, but does include the major bear market of the early noughties. I then grouped all the maximum decreases into bands - for the 2,531 days studied (1996-2006) I counted how many times the maximum drop was 0-5%, how many times it was in the range 5-10 % and so on. The tabulated results are:
This shows that, at least for this past ten year period, if you'd invested on any randomly selected day for had a small (4.1%) chance of experiencing a drop of 20-25% before things began to improve.
You had a much bigger chance (21.4%) of experiencing a drop of over 15%. And drops of less than 15% are quite common.
This emphasises why it is important not to use excessive gearing - you have a significant liklihood of getting a margin call if your LVR is much over 60% (remember, an 18.3% drop will trigger a margin call if your LVR was 60%). Using gearing conservatively (say less than 50% LVR) with a well-diversified portfolio reduces the chance of a margin call significantly.
My plan is to maintain an LVR of around 50%, giving me a gearing ratio of 2. Assuming I can borrow funds at around 7.5% on average, and my portfolio return averages around 9.0%, I would expect my return on equity (ROE) to be 9.0% + (9.0% - 7.5%) = 10.5%. Assuming inflation averages around 3.0%, this extra 1.5% return would mean my real (after inflation) return is increased by 33% using fairly modest gearing. And this would have a big impact on the final balance.
I prefer this approach (use of gearing) to that of boosting returns by including more risky assets in my portfolio because, theoretically, using gearing can provide more increase in return for an increased level of risk than just including a larger proportion of high-risk, high-return assets in your portfolio. Apparently it has something to do with the tangent of the line from the interest rate on the borrowed funds to the point on the efficient frontier corresponding to your asset mix having a steeper slope compared to just moving along the efficient frontier... Don't ask me to explain! As far as I can tell it looks something like the diagram below:
The idea is that you can increase the return of your "efficient" portfolio more by taking on extra risk through the use of gearing (ie. along the red line) than by changing the asset mix to include more risky assets (moving along the efficient frontier, assuming you have the right asset mix).
I don't worry too much about the details, as the entire concept of the efficient frontier seems fairly academic. In practice, you don't have precise data about all the assets in your portfolio (historic standard deviation, return, and covariance for all of the assets in your portfolio) or for determining the efficient frontier (such data on all possible assets mixes). Also, the usual problem of predicting the future using historic data applies. In practice, it seems that a sensible, well-diversified asset mix lies pretty close to the efficient frontier, and the use of gearing will be preferable to the inclusion of more risky assets in your portfolio (provided the interest rate on your investment loan isn't too high).
The other benefit of using gearing is that by having a larger total investment you are more able to make use of diversification.
Several things about the use of gearing (borrowing to invest) seem important to me:
1. You have to manage your risk - it is stupid (very risky) to borrow to invest in just one particular stock, or sector (eg. tech, oil, bio etc). I was amazed to learn that around 15% of margin loans are for accounts that have only one stock in them! The chances are you are not the next Warren Buffet (I know I'm not), so it's much more sensible to diversify - either via a portfolio of at least 10-12 stocks (not all in the same sector), or else via an index fund. Or a combination of both.
2. You have to borrow at the best possible interest rate - over time I've opened new margin lending accounts with lenders that offer a lower interest rate and that allow you to trade on your margin account via an online discount broker. Interest rates may be lower if you borrow a larger amount. I also have a margin lending account with the bank that provided my home and investment property loans - as a preferred customer I get 0.25% knocked of the standard interest rate. Most recently I used a "portfolio loan" secured against the equity in my real estate assets (similar to a HELOC?) to borrow at the standard home loan rate and invest in a portfolio of US shares (see my posts about my "Little Book" portfolio).
3. You should borrow less than the maximum so that you have a buffer against getting a margin call when the next market correction/bear market/crash happens. If the average margin for the stocks in your margin lending account is 70%, then you probably shouldn't get your loan-to-value ratio (LVR) above 50%.
The table below shows what % drop in the market would trigger a margin call for different starting values of gearing:
Assumptions:
Average 70% margin
Margin Call occurs if loan > 105% of margin value

                              % drop to   initial  initial  initial
Capital   Loan      Total     get a call  LVR      MU       DER      gearing
$100,000  $ 50,000  $150,000    54.6%     33.3%    47.6%     50.0%    1.5
$100,000  $ 60,000  $160,000    48.9%     37.5%    53.6%     60.0%    1.6
$100,000  $ 70,000  $170,000    43.9%     41.2%    58.8%     70.0%    1.7
$100,000  $ 80,000  $180,000    39.5%     44.4%    63.5%     80.0%    1.8
$100,000  $ 90,000  $190,000    35.5%     47.4%    67.7%     90.0%    1.9
$100,000  $100,000  $200,000    31.9%     50.0%    71.4%    100.0%    2.0
$100,000  $110,000  $210,000    28.7%     52.4%    74.8%    110.0%    2.1
$100,000  $120,000  $220,000    25.7%     54.5%    77.9%    120.0%    2.2
$100,000  $130,000  $230,000    23.0%     56.5%    80.7%    130.0%    2.3
$100,000  $140,000  $240,000    20.6%     58.3%    83.3%    140.0%    2.4
$100,000  $150,000  $250,000    18.3%     60.0%    85.7%    150.0%    2.5

LVR = loan-to-value ration (amount borrowed / total value of portfolio)
MU = margin utilisation    (amount borrowed / max. amount allowed)
DER = debt-to-equity ratio (amount borrowed / your equity)
Gearing is basically the "muplitplier effect" that will apply to any losses or gains made by the portfolio on your equity. For example, if the gearing used is 2.0, then if your portfolio went up 10% your equity will have increased 20%. Similarly, if the market "corrected" -15% causing your portfolio to drop -15%, your equity will have gone down by -30%.
As the loan amount stays constant, any drop in the value of your portfolio will decrease the margin value (eg. 70% of the portfolio value). This also means that your margin utilisation increases. Most lenders will give you a "margin call" if your margin utilisation exceeds 100%. (There's often a "buffer" of 5%, so you'd get a margin call if the MU was >105%). When you get a margin call you have to bring your MU back down to less than 100%. This can be done in several ways:
* put some cash into your account (ie. pay off some of the loan) - this is best
* put in some stocks (eg. if you had some unencumbered stocks you could add into the margin account) - this is second best, as only the margin value of the stock (say, 70%) counts.
* sell off some stocks - you may not want to sell at the price prevailing when you get a margin call.
The most interesting column in the table is the % drop required to trigger a margin call. Looking at daily closing price data for the Australian All-Ordinaries Index (similar to the S&P500), I calculated the maximum % drop ever experienced after buying on any particular date for the past ten years. This period doesn't include any once-in-a-lifetime crash like '87 or '29, but does include the major bear market of the early noughties. I then grouped all the maximum decreases into bands - for the 2,531 days studied (1996-2006) I counted how many times the maximum drop was 0-5%, how many times it was in the range 5-10 % and so on. The tabulated results are:
max drop   count  probability
 0% -  5%  1,069   42.2%
 5% - 10%    438   17.3%
10% - 15%    480   19.0%
15% - 20%    439   17.3%
20% - 25%    105    4.1%
25% - 30%      0    0.0%
30% - 35%      0    0.0%
35% - 40%      0    0.0%
     >40%      0    0.0%

    TOTAL  2,531  100.0%
This shows that, at least for this past ten year period, if you'd invested on any randomly selected day for had a small (4.1%) chance of experiencing a drop of 20-25% before things began to improve.
You had a much bigger chance (21.4%) of experiencing a drop of over 15%. And drops of less than 15% are quite common.
This emphasises why it is important not to use excessive gearing - you have a significant liklihood of getting a margin call if your LVR is much over 60% (remember, an 18.3% drop will trigger a margin call if your LVR was 60%). Using gearing conservatively (say less than 50% LVR) with a well-diversified portfolio reduces the chance of a margin call significantly.
My plan is to maintain an LVR of around 50%, giving me a gearing ratio of 2. Assuming I can borrow funds at around 7.5% on average, and my portfolio return averages around 9.0%, I would expect my return on equity (ROE) to be 9.0% + (9.0% - 7.5%) = 10.5%. Assuming inflation averages around 3.0%, this extra 1.5% return would mean my real (after inflation) return is increased by 33% using fairly modest gearing. And this would have a big impact on the final balance.
Saturday, 21 October 2006
PPP - Blue Monster 178
PayPerPost has just released another piece of the images required for their "payperpostbluemonster" puzzle competition, which will be starting soon! Check out the PayPerPost site for more details about their blog marketing approach.
The competition image piece is this:

It is a puzzle piece for a contest that will be announced in the near future. The first person to reassemble all the pieces and post it on their blog will get paid a $500 opportunity fee.
Best luck with the competition!
PayPerPost
The competition image piece is this:
It is a puzzle piece for a contest that will be announced in the near future. The first person to reassemble all the pieces and post it on their blog will get paid a $500 opportunity fee.
Best luck with the competition!
PayPerPost
6 Ways to NOT Scam yourself into Saving
I just read the Fugal Duchess' "6 Ways I Scam Myself into Saving" and although it's an entertaining post I have to disagree with each one of her 6 ideas - I'll explain why.
1. Hide-don't-Seek: I do this occasional by accident, and any "found" money goes into the kids money box as extra pocket money (My eldest son saves 100% of his pocketmoney anyhow, so it's a good deal). I would NOT do this scam intentionally as a) you risk losing notes if you just stuff bills into your pockets!, and b) how are you going to learn GOOD spending behaviour if you just avoid the effort?
2. Break the Bill: I do the exact opposite - I try to never take out cash (I use my day-to-day credit card for grocery shopping at the supermarket, doctors visits, bill payments etc. so I earn points - an extra 1% or so saving). When I have to take out cash (to make a payment that doesn't take credit cards, or charges a surcharge for payment by CC) I will then keep all the bills unbroken for as long as possible. I've trained myself hate having to hand over a nice whole bill and get a measly handful of "shrapnel" back. Also, having a random mix of small notes and many coins makes it hard to track exactly what you have spent each day and I find the money will magically disappear over a week if I don't keep an eagle-eye on it!
3. The Break-the-Bank trick: I've nothing against using banks or credit unions that have few ATMs or branches so that it is hard to take out funds (although these days you can use electronic payments to pay bills, transfer to savings accounts etc. so this doesn't really impact me as I don't use much cash) but I think selecting a bank where "the rates may be lousy" is just plain stupid - I'm sure you can find an inconvient bank with lousy service and GOOD rates! ;)
4. Duck-the-Flyer: It's almost impossible to avoid getting bombarded with junk mail, so I've trained myself to look through them but never buy anything that I hadn't been already planning on (of course this means that you need to think about your needs and wants in a quiet corner - not when window shopping or reading through catalogues!). If you avoid advertising flyers completely you'll miss out on specials/discounts on the stuff you DID intend to buy - never buy at full price.
5. Cart-the-Check Around or Keep the Check in the Mail: Cash it and transfer the money immediately into your high-yield online savings account. You have to cash it eventually anyway (or lose the money entirely), so what's the point in missing out on interest in the meantime?
And as for her favorite trick:
Eat gourmet ice cream.
If you can only avoid over-spending when you feel "over-indulged" you need both overeaters anonymous and spenders anonymous!.
"Toys" and "Stuff"
Over the years I've slowly grown out of the habit of buying "stuff" - mainly because I already have lots of cool "toys" that I don't have time to play with, and also because we really don't have any spare room to put more things. I don't count any of my "toys" in my net worth calculation as I don't intend to sell them, I don't know how much I'd get for any of them, and, if I sold them, I'd probably then have some room to buy new "stuff" so I wouldn't end up keeping any of the cash anyhow...
As you can see, my "stuff" has lost over 2/3 of it's value. If I'd invested the money instead, I'd probably have around $200,000 extra by now! Thus the total cost of my toys is around $171,500 opportunity cost - or around $10,000 per annum... Hmmm - how much fun have I really had with all this "stuff" anyhow? The upside is that I have plenty of activities to do with my kids for the 20 years without buying anything else!.
ps. I'm not really that well-disciplined. After Australia qualified for the 2nd round of the football (soccer) World Cup I got carried away and ordered a team shirt signed by all the team members. When it arrived I found that the display case is so large I don't really have anywhere to hang it - so it's sitting in it's delivery box behind the couch. Meanwhile the "10 easy monthly payments" are appearing on my day-to-day expenses credit card each month.
Some of my toys: [S=bought second hand, N=bought new, R=restored]
Item                          cost      est. value (?= hard to sell)
A hovercraft                $ 5,000 [S] $ 2,000
A boat                      $10,000 [S] $ 8,000
A 100 yr old steam engine*  $10,000 [S] $ ?     (* don't ask me why!)
Telescope, camera etc.      $ 8,000 [N] $ ?
Family car, compact         $12,000 [N] $ 5,000
Vintage car, restored       $20,000 [R] $10,000
Computers, various          $ 8,000 [N] $   500 (the 1980 ZX80 isn't worth much nowadays)
Sports equipment            $17,000 [N] $ 3,000
TOTAL                       $90,000     $28,500
Some of my toys: [S=bought second hand, N=bought new, R=restored]
Item cost est. value (?= hard to sell)
A hovercraft $ 5,000 [S] $ 2,000
A boat $10,000 [S] $ 8,000
A 100 yr old steam engine* $10,000 [S] $ ? (* don't ask me why!)
Telescope, camera etc. $ 8,000 [N] $ ?
Family car, compact $12,000 [N] $ 5,000
Vintage car, restored $20,000 [R] $10,000
Computers, various $ 8,000 [N] $ 500 (the 1980 ZX80 isn't worth much nowadays)
Sports equipment $17,000 [N] $ 3,000
TOTAL $90,000 $28,500
As you can see, my "stuff" has lost over 2/3 of it's value. If I'd invested the money instead, I'd probably have around $200,000 extra by now! Thus the total cost of my toys is around $171,500 opportunity cost - or around $10,000 per annum... Hmmm - how much fun have I really had with all this "stuff" anyhow? The upside is that I have plenty of activities to do with my kids for the 20 years without buying anything else!.
ps. I'm not really that well-disciplined. After Australia qualified for the 2nd round of the football (soccer) World Cup I got carried away and ordered a team shirt signed by all the team members. When it arrived I found that the display case is so large I don't really have anywhere to hang it - so it's sitting in it's delivery box behind the couch. Meanwhile the "10 easy monthly payments" are appearing on my day-to-day expenses credit card each month.
Friday, 20 October 2006
Setting My Financial Goals
I feel I am tracking nicely towards achieving a comfortable retirement, and have sufficient insurance in place to cover the usual "worst case" scenarios (death, T&PD, long-term partial disability). I also don't have any short or medium term "wants" or "needs" to use as short-term goals. Therefore the financial "goal" I've set myself is simply to achieve annual target values for my net worth.
I've based my projections of annual net worth targets on my current savings rate (36% of my gross salary), current net worth (should hit AUD$1M sometime in 2007), desired retirement pension (100% of my present salary, inflation adjusted), and what I hope is a realistic rate of return (9% pa) based on my continued use of gearing to a 50% LVR (100% gearing) and "aggressive" asset mix with a 50 year investment time period. I've also assumed that the relatively "low" inflation rate of the past decade (averaging 3% pa) will continue. For interest I've also projected outcomes if I attain a slightly better average rate of return, or inflation averages more than 3%, or I spend more than $80K pa during retirement.
Plugging these figures into an excel spreadsheet I get the following scenarios.
Baseline assumptions for Goal:
avg ROI 9.0%
avg CPI 3.0%
retirement @ 65
pension $80K in '06 $
end balance is at age 94
Model Results:
ANNUAL GOALS in order to achieve planned outcome:
contribute $30K pa net to savings each year, indexed to CPI
achieve avg total return of 9% (eg. 8.2% ROI with 50% LVR at int rate of 7.4%)
Other assumptions in my planning:
I've assumed a 0% tax rate on my earnings. This is partly to simplify the calculations, but also is a reasonable approximation as my primary residence and superannuation savings have 0% capital gains tax rate under current tax rules. My annual investment income is effectively nil as I use the tax deductible interest on my gearing (margin loans and investment property loans) to effectively "convert" investment income into unrealised capital gains.
I have sufficient medical coverage through the Australian "Medicare" system, which subsidises visits to the doctor, pharmaceuticals and public hospital care. We also have basic private hospital cover in case we require any elective surgery (eg. hip replacements, heart bypass etc.), and because if I didn't have basic private hospital cover I'd have to pay the same (or more) as a tax surcharge.
As I'm currently already funding my own part-time post-graduate studies, I expect to be able to cover the costs of my two sons' education costs up to a first degree at university. It helps that our free public primary and secondary education system is quite good. One or both of my sons might qualify for entry to a selective high-school, or may get an academic part scholarship to a private high school. Our universities currently charge around 50% of the "full cost" - so a basic 3-yr business or science degree costs around $25,000 if you live at home.
I've based my projections of annual net worth targets on my current savings rate (36% of my gross salary), current net worth (should hit AUD$1M sometime in 2007), desired retirement pension (100% of my present salary, inflation adjusted), and what I hope is a realistic rate of return (9% pa) based on my continued use of gearing to a 50% LVR (100% gearing) and "aggressive" asset mix with a 50 year investment time period. I've also assumed that the relatively "low" inflation rate of the past decade (averaging 3% pa) will continue. For interest I've also projected outcomes if I attain a slightly better average rate of return, or inflation averages more than 3%, or I spend more than $80K pa during retirement.
Plugging these figures into an excel spreadsheet I get the following scenarios.
Baseline assumptions for Goal:
avg ROI 9.0%
avg CPI 3.0%
retirement @ 65
pension $80K in '06 $
end balance is at age 94
Model Results:
                        ----model parameters--- RESULT
        SCENARIOS       earning CPI     pension end
                        rate    rate   amount   balance
                         9.00%  3.00%   $80K    $16,575,706
                        10.00%  3.00%   $80K    $27,887,622
                        11.00%  3.00%   $80K    $45,667,238
                        12.00%  3.00%   $80K    $73,398,333
                higher   9.00%  4.00%   $80K    $ 9,143,582
              inflation 10.00%  4.00%   $80K    $16,014,005
                        11.00%  4.00%   $80K    $26,875,435
                        12.00%  4.00%   $80K    $43,885,456
                higher   9.00%  3.00%   $90K    $15,809,024
               pension   9.00%  3.00%  $100K    $15,042,342
              spending   9.00%  3.00%  $110K    $14,275,660
                         9.00%  3.00%  $120K    $13,508,979
ANNUAL GOALS in order to achieve planned outcome:
contribute $30K pa net to savings each year, indexed to CPI
achieve avg total return of 9% (eg. 8.2% ROI with 50% LVR at int rate of 7.4%)
Other assumptions in my planning:
I've assumed a 0% tax rate on my earnings. This is partly to simplify the calculations, but also is a reasonable approximation as my primary residence and superannuation savings have 0% capital gains tax rate under current tax rules. My annual investment income is effectively nil as I use the tax deductible interest on my gearing (margin loans and investment property loans) to effectively "convert" investment income into unrealised capital gains.
I have sufficient medical coverage through the Australian "Medicare" system, which subsidises visits to the doctor, pharmaceuticals and public hospital care. We also have basic private hospital cover in case we require any elective surgery (eg. hip replacements, heart bypass etc.), and because if I didn't have basic private hospital cover I'd have to pay the same (or more) as a tax surcharge.
As I'm currently already funding my own part-time post-graduate studies, I expect to be able to cover the costs of my two sons' education costs up to a first degree at university. It helps that our free public primary and secondary education system is quite good. One or both of my sons might qualify for entry to a selective high-school, or may get an academic part scholarship to a private high school. Our universities currently charge around 50% of the "full cost" - so a basic 3-yr business or science degree costs around $25,000 if you live at home.
Thursday, 19 October 2006
The types of Investment Risk
A key component in deciding the asset mix you want to include in your total investment portfolio is "risk". In financial planning terms, market risk is defined as the variability of returns from an investment, or "the uncertainty of a future outcome". Although we are really only concerned by the likelihood of a LOSS, using volatility to measure risk is OK, as the standard deviation of investment returns is used to measure volatility, and this is directly related to the risk of an exceptional LOSS as well as the "risk" of an unusually GAIN.
Total risk = General risk + Specific risk
= Market risk + Issuer risk
= Systematic risk + Nonsystematic risk
The total risk of an asset is a combination of the many possible sources of risk.
Some of these risks overlap eg. the principal risk may be a combination of market risk, business risk and regulation risk. It is not possible to measure of estimate some of these risks accurately, but it is still important to mentally run through this list whenever you are considering a new investment.
Standard deviation is a measure of the total risk of an asset or a portfolio, including therefore both systematic and unsystematic risk. For any investment, the "total risk" can be calculated from data on periodic (daily or monthly) valuations (prices) using the formula:
std dev = SQRT[{1/N}xSUM(Xi-mean)^2]
where;
N is the number of data points,
Xi is the ith measured value,
mean is the mean (average) of all the values,
and the SUM is for all values (for i=1 to N).
Standard deviation for many investments is available online or in magazines. If you have an investment and have periodic (eg. daily) unit prices you can caluculate the standard deviation yourself. A tutorial on how to calculate standard deviation for your investment data using excel is available here.
Typically, the standard deviation of the annual returns for various asset classes are as follows:
A couple of points to be in mind are that
a) standard deviation is a measure HISTORIC risk - ie. if you use this in your planning, you are automatically assuming that risk in the future will continue at the same levels as in the past - this isn't always true (the collapse of several hedge funds provide examples of coming undone when risk levels suddenly change).
"Although standard deviations based on realized returns are often used as proxies for expected standard deviations, investors should be careful to remember that the past cannot always be extrapolated into the future without modifications. Historic standard deviations may be convenient, but they are subject to errors. One important point about the estimation of standard deviation is the distinction between individual securities and portfolios. Standard deviations for well- diversified portfolios are reasonably steady across time, and therefore historical calculations may be fairly reliable in projecting the future. Moving from well- diversified portfolios to individual securities, however, makes historical calculations much less reliable. Fortunately, the number one rule of portfolio management is to diversify and hold a portfolio of securities, and the standard deviations of well-diversified portfolios may be more stable." - Learing for Life.
b) you had to pick a particular period to use for calculating risk - did you use data for the past year, past 10 years, all available data?
If you have a figure for the risk level of a particular investment, and know its expected rate of return, and its covariance with the other investments in your portfolio you could then work out where your current/planned asset allocation sits in relation to the efficient frontier, and make any sensible adjustments.
Your Tolerance for Investment Risk
Each individual investor has a different level of tolerance for risk. This may depend on your age, salary and expenses, health, family, and personality.
Conservative investors are more concerned with safety of principal and minimizing risk, and can accept a lower rate of return in exchange for added peace of mind.
Aggressive investors prefer to maximize the return on investment with a more flexible strategy, and are willing to accept a higher degree of risk.
You should ask yourself the following questions to assess your risk tolerance.
- What Are Your Investment Goals?
- How much you can invest, and what rate of return on investment will you need to achieve these financial goals?
- When Will You Need the Investment Income? ie. What investment timeframe are you looking at?
- Are You Comfortable with the Possibility of Losing Money?
Once you know your own risk tolerance, you are in a position to evaluate any new investment in light of it's expected risk and return.
One school of thought is that it is best to be more aggressive and take more risks when you are starting out/younger as you will have more time to "catch up" if things go wrong. I personally think that even young investors should start out with more conservative investments and then start to add more risky investments into their portfolio over time. This way you'll get to know your risk tolerance based on actual experience rather than questionaires etc.
Total risk = General risk + Specific risk
= Market risk + Issuer risk
= Systematic risk + Nonsystematic risk
The total risk of an asset is a combination of the many possible sources of risk.
Inflation risk     - the chance the money you have invested will
                     decline in real value due to inflation.
Principal risk     - the chance that your original investment will
                     decline in value or be lost entirely.
Credit risk        - the chance a borrower will default on an
                     obligation.
Market risk        - the likelihood that a broad investment market,
                     such as the bond or stock market, will decline
                     in value.
Liquidity risk     - the possibility you won't be able to sell or
                     convert a security into cash when you need the
                     money.
Interest Rate Risk - the variability in a security�s return resulting
                     from changes in the level of interest rates
Regulation Risk    - The risk of a regulatory change that could
                     adversely affect the stature of an investment
                     (eg. changes to the tax law)
Business Risk      - the risk of doing business in a particular industry
                     or environment is called business risk
Reinvestment Risk  - the risk that dividends/coupons will not be
                     reinvested, or cannot be reinvested at the same
                     rate, so that yield to maturity (YTM) isn't attained.
Exchange Rate Risk - the variability in returns on securities caused by
                     currency fluctuations (aka "currency risk")
Country Risk       - the chance of loss due to stability and viability of
                     a country's economy (aka "political risk")
Valuation Risk     - the chance that a an investment is overvalued
                     (eg. bubbles)
Timing Risk        - the chance that other factors cause you to buy or
                     sell an investment at an inappropriate time
Forced Sale Risk   - the chance that an investment is liquidated
                     involuntarily eg. takeover, fund closure
Inflation risk - the chance the money you have invested will
decline in real value due to inflation.
Principal risk - the chance that your original investment will
decline in value or be lost entirely.
Credit risk - the chance a borrower will default on an
obligation.
Market risk - the likelihood that a broad investment market,
such as the bond or stock market, will decline
in value.
Liquidity risk - the possibility you won't be able to sell or
convert a security into cash when you need the
money.
Interest Rate Risk - the variability in a security�s return resulting
from changes in the level of interest rates
Regulation Risk - The risk of a regulatory change that could
adversely affect the stature of an investment
(eg. changes to the tax law)
Business Risk - the risk of doing business in a particular industry
or environment is called business risk
Reinvestment Risk - the risk that dividends/coupons will not be
reinvested, or cannot be reinvested at the same
rate, so that yield to maturity (YTM) isn't attained.
Exchange Rate Risk - the variability in returns on securities caused by
currency fluctuations (aka "currency risk")
Country Risk - the chance of loss due to stability and viability of
a country's economy (aka "political risk")
Valuation Risk - the chance that a an investment is overvalued
(eg. bubbles)
Timing Risk - the chance that other factors cause you to buy or
sell an investment at an inappropriate time
Forced Sale Risk - the chance that an investment is liquidated
involuntarily eg. takeover, fund closure
Some of these risks overlap eg. the principal risk may be a combination of market risk, business risk and regulation risk. It is not possible to measure of estimate some of these risks accurately, but it is still important to mentally run through this list whenever you are considering a new investment.
Standard deviation is a measure of the total risk of an asset or a portfolio, including therefore both systematic and unsystematic risk. For any investment, the "total risk" can be calculated from data on periodic (daily or monthly) valuations (prices) using the formula:
std dev = SQRT[{1/N}xSUM(Xi-mean)^2]
where;
N is the number of data points,
Xi is the ith measured value,
mean is the mean (average) of all the values,
and the SUM is for all values (for i=1 to N).
Standard deviation for many investments is available online or in magazines. If you have an investment and have periodic (eg. daily) unit prices you can caluculate the standard deviation yourself. A tutorial on how to calculate standard deviation for your investment data using excel is available here.
Typically, the standard deviation of the annual returns for various asset classes are as follows:
- Money market (cash): 2%-3%
Short-term bond: 3%-5%
Long bond: 6%-8%
Domestic stocks (conservative): 10-14%
Domestic stocks (aggressive): 15%-25%
Foreign stocks: 15%-25%
Emerging Markets stocks: 25%-35%
A couple of points to be in mind are that
a) standard deviation is a measure HISTORIC risk - ie. if you use this in your planning, you are automatically assuming that risk in the future will continue at the same levels as in the past - this isn't always true (the collapse of several hedge funds provide examples of coming undone when risk levels suddenly change).
"Although standard deviations based on realized returns are often used as proxies for expected standard deviations, investors should be careful to remember that the past cannot always be extrapolated into the future without modifications. Historic standard deviations may be convenient, but they are subject to errors. One important point about the estimation of standard deviation is the distinction between individual securities and portfolios. Standard deviations for well- diversified portfolios are reasonably steady across time, and therefore historical calculations may be fairly reliable in projecting the future. Moving from well- diversified portfolios to individual securities, however, makes historical calculations much less reliable. Fortunately, the number one rule of portfolio management is to diversify and hold a portfolio of securities, and the standard deviations of well-diversified portfolios may be more stable." - Learing for Life.
b) you had to pick a particular period to use for calculating risk - did you use data for the past year, past 10 years, all available data?
If you have a figure for the risk level of a particular investment, and know its expected rate of return, and its covariance with the other investments in your portfolio you could then work out where your current/planned asset allocation sits in relation to the efficient frontier, and make any sensible adjustments.
Your Tolerance for Investment Risk
Each individual investor has a different level of tolerance for risk. This may depend on your age, salary and expenses, health, family, and personality.
Conservative investors are more concerned with safety of principal and minimizing risk, and can accept a lower rate of return in exchange for added peace of mind.
Aggressive investors prefer to maximize the return on investment with a more flexible strategy, and are willing to accept a higher degree of risk.
You should ask yourself the following questions to assess your risk tolerance.
- What Are Your Investment Goals?
- How much you can invest, and what rate of return on investment will you need to achieve these financial goals?
- When Will You Need the Investment Income? ie. What investment timeframe are you looking at?
- Are You Comfortable with the Possibility of Losing Money?
Once you know your own risk tolerance, you are in a position to evaluate any new investment in light of it's expected risk and return.
One school of thought is that it is best to be more aggressive and take more risks when you are starting out/younger as you will have more time to "catch up" if things go wrong. I personally think that even young investors should start out with more conservative investments and then start to add more risky investments into their portfolio over time. This way you'll get to know your risk tolerance based on actual experience rather than questionaires etc.
Wednesday, 18 October 2006
Common mistakes in Personal Finance
Some common mistakes people make when planning their finances:
- Not setting measurable financial goals.
Thinking that only the wealthy need a financial plan.
Thinking that you can avoid starting to plan until you get get older.
Thinking that financial planning is the same as retirement planning.
Confusing financial planning with investing.
Making a financial decision without understanding its possible effects on other aspects of their finances.
Neglecting to review their financial plan periodically.
Waiting until a money crisis to begin financial planning.
Expecting unrealistic returns on investments.
Thinking that you can leave decision making to a financial planner.
Not understanding what a financial planner is advising.
Paying excessive fees for the sake of convenience.
Believing that financial planning is primarily tax planning.
Creating a Google Sitemap
OK, I admit this is more technogeek than personal finance, but as lots of pfblog.org blogs appear to be hosted by blogger.com I thought this might be useful to some readers.
Basically, you can register your website (xxx.blogspot.com) with the google Webmaster Tools sitemap service. This will give you useful info about when your site was last spidered, how many pages have been indexed etc. One option is to provide a SITEMAP listing all your pages. This may help with getting all your pages indexed by google asap, and therefore increase your traffic/readership.
While searching for how to save a sitemap.txt file onto my blogspot.com site, I found out that if you have your blog setup to provide atom RSS feeds AND you're using the "old" blogger.com (not the BETA version), then you can simply specify your atom feed as the sitemap file! ie. enter the sitemap URL as http://yourblog.blogspot.com/atom.xml
This ensures all my recent post permlink URLs are being indexed by google after they were published. Before I set up this sitemap URL Google had last spidered my site 9 days previously and had indexed 29 pages. After setting up the atom.xml page as the sitemap file, Google had reindexed my site and found 37 pages.
Tuesday, 17 October 2006
Generational differences in home lending attitudes
A recent survey conducted as part of the Fujitsu/JPMorgan Australian Mortgage industry Report (Volume 4) found that there are significant differences in attitudes towards mortgage lenders and awareness of interest rates between different age groups.
The survey divided respondents into four groups by age - Seniors (over 60 years old), Baby Boomers (between 45-60), Generation X (between 30-45) and Generation Y (between 18-30).
The survey found that:
* Significantly more Baby Boomers and Generation X prefer to use a mortgage broker, compared to Seniors and Generation Y respondents, who said they would prefer to use a bank for their home loan needs.
* Generation Xers are more aware of mortgage interest rates - with 88 per cent claiming they could quote the interest rate on their mortgage while only 22 per cent could quote the interest rate on their credit card.
* Baby Boomers were also considerably more aware of their mortgage interest rate with 55 per cent of respondents claiming they could quote the interest rate on their mortgage, compared to 28 per cent who could quote the interest rate on their credit card. On the other hand, only 32 per cent of Seniors and 24 per cent of Generation Y respondents were aware of the interest rate on their home loans. (Perhaps because most people in these last two groups don't HAVE a home loan!)
* Generation X showed the highest predilection towards fixed rate loans, with more than 51 per cent claiming they would consider a long-term fixed rate re-finance compared to 31 per cent of Baby Boomers, 13 per cent of Generation Y and one per cent of Seniors.
* Boomers were more likely to have investment properties than Seniors (67 per cent and 41 per cent respectively).
* Owner-occupied mortgages were most prevalent amongst the Generation X group (55 per cent) while investment mortgages were significantly more popular in the Baby Boomer group (59 per cent).
* Unsecured lending was most common in the younger peer groups, with 36 per cent of Generations Y and 22 per cent of Generation X with unsecured car loans.
personal finance
money
real estate
Monday, 16 October 2006
Online savings accounts - EasyStreet $20 bonus
Lots of PF Blogs devote many posts to announcements of new online savings accounts, rate changes, joining bonuses etc. I'll simply provide a link to a comprehensive comparison of Australian online savings accounts, and provide some links to those that provide joining & referral bonuses:
Get a AUD$20 joining bonus for a new Easy Saver Account if you apply using the following referral details:
1. Apply for an EasySavings account (Australian bank account needed)
2. Answer the question: "How did you hear about EasyStreet?" by selecting "friend, family member or acquaintance"
3. Enter my name "Ralph Morgan" and postcode "2087" as the referrer
(Disclosure: I'll also get $20 for attracting a new customer)
Disclaimer: This information is general in nature and not tailored to your situation. It is not financial advice. More information is available in the Easy Street Savings Product Disclosure Statement (PDS). You should read and consider the PDS before deciding whether to apply for this product.
personal finance
money
saving
My thoughts on Prosper.com
As I don't have a US SSN I can't invest in Prosper.com, but I've seen quite a lot of posts by PF bloggers considering investing this way. Although the idea is interesting, and I might be tempted to invest a few hundred dollars myself if I could (bear in mind this would only be a tiny % of my total invested assets), I have some concerns which I posted as comments on Fearless Money.
I think they have general application to anyone considering putting money into Propser.com loans, so I'll repeat my comments here:
It's probably also worth remembering that back in the good old days of "community lending" a run on the local bank often meant that the depositors ended up losing their entire life's savings.
I think they have general application to anyone considering putting money into Propser.com loans, so I'll repeat my comments here:
Please review the concepts of "there'no such thing as a free lunch" and the trade-off between "risk vs. reward" before investing in Prosper.com
And remember that buying 11 small lots of a single risky investment class does NOT reduce risk, as you are not actually diversifying if you stick within a single asset class/sector. eg. if the economy tanks then ALL Prosper.com borrowers have an increased chance of defaulting.
Also, remember that they're lots of investors looking over the Prosper.com opportunities, so to "win" a slice of debt you have to underbid the others- ie. you were willing to take the LEAST return for the estimated risk.
You may luck out and have 10x$100 invested at 11% and get it all back with interest. But, based on the current "riskless" rate of around 5%, it's more likely that you'll not get paid the full interest due on several of these parcels.
There's also a risk that you might not get your $100 capital back either. Did you notice the following bits in the Prosper.com FAQs?
"There are no guarantees that your loan will be repaid"
and
"Prosper is not directly insured by the FDIC, but lenders' deposits are covered up to $100,000 by FDIC pass-through insurance provided by our banking partner, Wells Fargo Bank."
The bit about NOT being insured by the FDIC is clear. I've no idea what FDIC "pass-through" insurance is - it might just mean you're insured against Wells Fargo losing your money during transit from your account to the borrowers! If you intend to invest in Proper you should know exactly what this means, and get confirmation from Wells Fargo in writing.
The first rule of investing is "if it looks too good to be true, it probably is". I'm not sure if that's covered in "Secrets [sic] of the Millionaire Mind" or "Millionaire Maker's Guide..."
It's probably also worth remembering that back in the good old days of "community lending" a run on the local bank often meant that the depositors ended up losing their entire life's savings.
Blog Review - EW turns three (months)
Get Rich Slowly [link] has just done a review of his blog's progress over the past six months. Aside from being green with envy at his blog's success (and his writing ability), I thought that some feedback on my blog would be extremely useful. So I'm asking for your feedback. (With acknowledgement to Get Rich Slowly for the structure of this post - it hardly seemed worth reinventing the wheel).
Enough Wealth began three months ago (19 July to be exact). In that time, it has started to slowly build up some momentum:
I'd love to get your comments (more, more!), suggestions, and contributions. To quote GRS "If you find something that other readers should see, send it in. If you have a question about personal finance, let me know. Your feedback (good and bad) will help to improve this site. Please let me know what you think, either in the comments or via e-mail."
Where my Reader's are from:
As an Aussie blogging from Sydney, I'm thrilled that 78% of my readers are in the US and Canada (but a bit perplexed that I have no readers here in Oz!) I think this probably has to do with most readers finding me via links on pfblogs.org and a handful of PF blogs [thanks Free Money Finance, Living Poor, and 1stMillionAt33].
BTW - If any other bloggers have tips on increasing traffic, please let me know.
Enough Wealth began three months ago (19 July to be exact). In that time, it has started to slowly build up some momentum:
Posts:         61 (1.0/day)
Comments:       3 (0.03/day) !
Spam:           1 (0.01/day)
Visitors:     553 (16/day) since 25/9
Page Views: 1,045 (53/day)
Subscribers:    2 (0 by email)
I'd love to get your comments (more, more!), suggestions, and contributions. To quote GRS "If you find something that other readers should see, send it in. If you have a question about personal finance, let me know. Your feedback (good and bad) will help to improve this site. Please let me know what you think, either in the comments or via e-mail."
Where my Reader's are from:
United States  68%
Canada         10%
India           9%
Romania         5%
Japan           2%
Poland          1%
New Zealand     1%
Ireland         1%
United Kingdom  1%
Germany         1%
Other           1%
As an Aussie blogging from Sydney, I'm thrilled that 78% of my readers are in the US and Canada (but a bit perplexed that I have no readers here in Oz!) I think this probably has to do with most readers finding me via links on pfblogs.org and a handful of PF blogs [thanks Free Money Finance, Living Poor, and 1stMillionAt33].
BTW - If any other bloggers have tips on increasing traffic, please let me know.
Sunday, 15 October 2006
Are you being "managed" out of your money?
I recently had a chance to look through the training materials provided by a leading financial planning/wealth management company (it "fell off the back of a table"). It confirms my suspicions that the main target of most "wealth management" services is to manage as much money as possible from your account into their pockets - hopefully while providing you with sufficient residual return on your investments (after fees) that you don't take your business elsewhere.
For example, due to increased competition reducing the margin available in the traditional stock-broking based model which focused on equities research and transactional fees (read "churning"), they are aiming to move to a fee-based "scaleable wealth management" model. The target is to move from having 200+ clients per advisor yielding $4K in revenue per client (from brokerage), to having fewer, high net worth clients - 100 clients yielding $30K+ revenue each (from fees). This is to be achieved by putting such clients into "high margin, high sophistication" products. (read "expensive and hard to understand")
The main driver for this move is a graph showing that the average brokerage rates have dropped below trailing commisions - so it is better for them to push managed products rather than direct equity investments.
An interesting part of the transition plan was how to eliminate current clients that are "small" and "unscalable" by shifting them to a discount broker or "other advisor" . And the methods for finding new "scalable" clients included:
* Internet Research
* Relationships with accounts and lawyers who focus on sales of businesses
* Look for ads of business sales in newspapers
* Relationships with Private Equity companies who will be buying businesses
I found it intriguing that the entire focus was on how to maximise fees from clients, and not a word about maximising returns for their clients, or any relationship between fees and performance.
In a similar vein, the Sydney Morning Herald recently had an article written a student financial planner. It gives a stark insight into just how much the financial planning industry is oriented towards maximising fee revenue, with just enough consideration of the clients needs and situation to avoid running afoul of the regulating bodies. Read Confessions of a student planner.
personal finance, investment, investing, wealth
UK online savings accounts, credit cards and personal loans
Mungo Money, a new UK personal finance site, provides information about credit cards & personal loans available in the UK. I also found that the page listing available online savings accounts, which provides links and information about current interest rates available, would be useful to any of my UK readers in the UK. If you want to compare UK credit cards or get information on the rates available for online savings accounts, this site will be of interest.
PayPerPost, money, saving, credit cards
PayPerPost, money, saving, credit cards
Monetization: PPP
As a blog about personal finance, one of the topics I cover is the monetization of this blog. While I'm all for earning a little bit extra here and there, I don't want sponsorship (ads/links) to be inappropriate or intrusive. I also don't want my posts to be biased by sponsorship requirements.
My monetization "goal" is to eventually generate enough income to cover costs associated with blogging - my monthly broadband bill, pfblogs "friends" fee etc. But I don't expect it will ever generate any return on the time spent blogging - but that's fine as blogging about PF is a hobby, not work. And I spend a large chunk of my personal time reading about PF and managing my investments anyhow.
To add another "potential" source of revenue I've setup an account with PayPerPost.
My personal rules about using PayPerPost are as follows:
1) If, and only if, I see an "opportunity" that I find interesting and I can honestly write a "suitable" (ie. neutral or positive) post about it, I'll include a post about it in this blog.
2) I'll use the technorati tag "PayPerPost" (or PPP) to clearly denote all sponsored posts. Any readers who find sponsored posts objectionable can simply skip over these posts.
3) If an "opportunity" on PPP is interesting, but I want to write a negative post about it, I'll NOT tag the post as PPP, and I'll also not include the required link. ie. it won't be a sponsored post.
4) Any PPP posts will be additional to my usual, unsponsored posting, so this blog isn't in danger of becoming a link farm or a splog.
PayPerPost - actually, this post isn't sponsored, but the tag is relevant ;)
Frugal living: credit cards
Yes, Credit Cards CAN be good for you! I have one credit card that I use for all my day-to-day expenses (shopping, petrol, bill payments) but as I pay off the balance each month in full, it doesn't cost me a cent in interest - the only cost to me is the annual fee of $19.80
The card has a "rewards" program which gives you some points for spend, and one of the redemption options is to get a $100 credit onto your card for 13,500 points.
This past year I've made $75.46 net profit from using my credit card (no, using a card for payments does NOT change my shopping habits and encourage me to spend more - in my mind putting $10 onto the card is exactly the same as taking a $10 note out of my wallet):
a) not spend any more using the card than you would using cash,
b) always pay it off in full each month,
c) the card has a low (or no) annual fee, and
d) there's no fee for participating in the rewards program.
Over the past 20 years that I've had this same credit card, I've forgotten to pay it off by the due date three times, and have then had to pay interest on all purchases for the current month and next next billing period. On each occasion it would have cost me as much in interest as I earn in points for the entire year! This makes me VERY careful to pay the balance off in full on time - these days its much easier as I can schedule an automatic payment from my credit union savings account to my bank credit card on the due date.
One other benefit of having a credit card is that the credit limit ($15,000 on my day-to-day credit card) would allow me to cover my basic living costs for six months in the event of an "emergency". So I can choose how much to keep in interest-bearing cash accounts, rather than having to keep six months spending money sitting there.
Of course I have some other credit cards that are only used to obtain a 0% balance transfer offers, which will earn me interest on the amount I've borrowed from those lenders at 0%.
And I have one credit card used only for making internet purchases - usually only $20 or so every couple of months. I use a separate card for these purchases so that if the card details ever got stolen and misused I could cancel the card immediately to avoid liability, and it wouldn't cause any problems with my scheduled bill payments coming off my day-to-day credit card as usual.
saving
The card has a "rewards" program which gives you some points for spend, and one of the redemption options is to get a $100 credit onto your card for 13,500 points.
This past year I've made $75.46 net profit from using my credit card (no, using a card for payments does NOT change my shopping habits and encourage me to spend more - in my mind putting $10 onto the card is exactly the same as taking a $10 note out of my wallet):
Spend = $35,234.89Of course, this only works if you have the self-discipline to
Points = 12,861
= $95.26 credit onto my card
fee = -$19.80 pa
profit = $75.46
a) not spend any more using the card than you would using cash,
b) always pay it off in full each month,
c) the card has a low (or no) annual fee, and
d) there's no fee for participating in the rewards program.
Over the past 20 years that I've had this same credit card, I've forgotten to pay it off by the due date three times, and have then had to pay interest on all purchases for the current month and next next billing period. On each occasion it would have cost me as much in interest as I earn in points for the entire year! This makes me VERY careful to pay the balance off in full on time - these days its much easier as I can schedule an automatic payment from my credit union savings account to my bank credit card on the due date.
One other benefit of having a credit card is that the credit limit ($15,000 on my day-to-day credit card) would allow me to cover my basic living costs for six months in the event of an "emergency". So I can choose how much to keep in interest-bearing cash accounts, rather than having to keep six months spending money sitting there.
Of course I have some other credit cards that are only used to obtain a 0% balance transfer offers, which will earn me interest on the amount I've borrowed from those lenders at 0%.
And I have one credit card used only for making internet purchases - usually only $20 or so every couple of months. I use a separate card for these purchases so that if the card details ever got stolen and misused I could cancel the card immediately to avoid liability, and it wouldn't cause any problems with my scheduled bill payments coming off my day-to-day credit card as usual.
saving
Saturday, 14 October 2006
My "alternative" investments
Aside from the main part of my investment portfolio being in stocks and property, I have a minor portion of my portfolio (around 5%) invested in some "alternative" assets:
While these are possibly good "diversification" assets, and, at least in the case of the agribusiness investements, assisted with tax planning, they have several substantial drawbacks:
* illiquid - the units in the hedge funds can be redeemed upon request, but it takes at least a month. The agribusiness units are "locked in" until maturity, unless you want to try to sell them privately (at a bargain price).
* difficult to value - the hedge funds publish a monthly "unit price". The others I just value at "cost" (except the FLIC which I wrote off ages ago) and hope for the best in the long term. There's really no way to guess what the prices for woodchips, teak and sandlewood will be in 5-10 years time (although the sales brochures have some really fancy looking graphs!)
* management fees - think of the worst possible combination of insurance "up front" sales commission, followed by the sort of on-going fees the hedge funds charge for "outperformance"! Boo, hiss.
* risk-adjusted return - the return (after fees) is probably insufficient for the amount of risk involved, although it's hard to evaluate with them being a part of a diversified portfolio. For example, my $5,000 FLIC investment provided an immediate tax deduction, but has since only returned around 15% of the amount invested and is being wound up with no residual value. At least I may be able to claim a capital loss on my tax return this year.
In terms of reporting, the hedge funds are held in one of my margin loan accounts, so I just include their value in my "equtities" total, along with a notional "value" ie. cost base) for my agribusiness investments.
So far, the Hedge funds have performed pretty well:
and have a low co-variance with my share investments, thus reducing overall "risk" (volatility).
I bought them without any gearing (debt), and have since transferred them into one of my margin loan accounts to provide extra collateral. As I'm not using making use of the increased borrowing capacity, they act to greatly reduce the chance of getting a margin call.
I also have a tiny amount of other "alternative" asset classes like coins and gold bullion - but I don't bother trying to include these (or my cars/household items) in my net worth calculations as they're not really liquid.
personal finance
investment
investing
Hedge Funds  - Ord Minnett OM-IP 220 series 1,
               OM-IP 320,
               OM-IP Strategic Ltd.
Agribusiness - Timbercorp Timberlots (1999),
               Rewards Teak Project (2005),
               Rewards Sandlewood Project (2005)
Other        - Macquarie Film Investment Fund (FLIC)
While these are possibly good "diversification" assets, and, at least in the case of the agribusiness investements, assisted with tax planning, they have several substantial drawbacks:
* illiquid - the units in the hedge funds can be redeemed upon request, but it takes at least a month. The agribusiness units are "locked in" until maturity, unless you want to try to sell them privately (at a bargain price).
* difficult to value - the hedge funds publish a monthly "unit price". The others I just value at "cost" (except the FLIC which I wrote off ages ago) and hope for the best in the long term. There's really no way to guess what the prices for woodchips, teak and sandlewood will be in 5-10 years time (although the sales brochures have some really fancy looking graphs!)
* management fees - think of the worst possible combination of insurance "up front" sales commission, followed by the sort of on-going fees the hedge funds charge for "outperformance"! Boo, hiss.
* risk-adjusted return - the return (after fees) is probably insufficient for the amount of risk involved, although it's hard to evaluate with them being a part of a diversified portfolio. For example, my $5,000 FLIC investment provided an immediate tax deduction, but has since only returned around 15% of the amount invested and is being wound up with no residual value. At least I may be able to claim a capital loss on my tax return this year.
In terms of reporting, the hedge funds are held in one of my margin loan accounts, so I just include their value in my "equtities" total, along with a notional "value" ie. cost base) for my agribusiness investments.
So far, the Hedge funds have performed pretty well:
  Fund     Date      Date     Unit Price ROI
           Issued    Matures  (Aug 06)   pa
OM-IP 220  Aug '97   Jun '15  $3.9465  15.35%
OM-IP 320  Dec '98   Jun '07  $1.7648   7.43%
OM-IP S/L  Aug '99   Jun '08  $2.1426  10.93%
and have a low co-variance with my share investments, thus reducing overall "risk" (volatility).
I bought them without any gearing (debt), and have since transferred them into one of my margin loan accounts to provide extra collateral. As I'm not using making use of the increased borrowing capacity, they act to greatly reduce the chance of getting a margin call.
I also have a tiny amount of other "alternative" asset classes like coins and gold bullion - but I don't bother trying to include these (or my cars/household items) in my net worth calculations as they're not really liquid.
personal finance
investment
investing
Education costs - getting work to pay
It's always good to get some "free" money from your employer. Yesterday I had my application for study assistance approved, up to a maximum of $1200 this year. I'm currently doing a Masters in IT by distance education and my employer has agreed to reimburse me for 50% of the course fees for the subjects I'm doing this year (paid when I pass each subject). As the course fees are tax deductible [as "work related self-education" expenses] the refund from the company will be somewhat offset by the reduced tax deduction, but I'll still end up ahead by about $900.
As usual the process of applying for study assistance is extremely bureaucratic - I'd previously had an application to be reimbursed for the entire cost of the degree approved - unfortunately the approval was only "valid" for that particular financial year budget, and as the degree will take about 8 years of part-time study by distance education this ended up meaning I got nothing refunded for the subjects I completed that year. Working out how to submit an application worded in a way that means I'm entitled to get some money back within the current budget period took some doing!
As I'd already budgeted for paying my course fees, when I get the refund money I'll probably use it to by some shares for my new baby boy.
personal finance
money
saving
Blog Monetization update: Jul-Sep 2006
In keeping with the "open wallet" philosophy, I'll track my progress monetarizing this blog.
ps. In case anyone is wondering why I've included Amazon.com and AdSense links in the "body" section of my blog, it's simply that my template currently only lets my post content start to appear after the end of any sidebar material - so including all sponsored material in the sidebar would mean a huge amount of whitespace appearing between the posting date (which does indent correctly for some reason) and the start of the actual post content! If I work out how to fix my blogger template I'll move all the "ads" into my sidebar.
monetization
        income expense
Jul 06: $ 0.00 -$ 0.00
Aug 06: $ 0.00 -$ 0.00
Sep 06: $ 0.00 -$ 0.00
ps. In case anyone is wondering why I've included Amazon.com and AdSense links in the "body" section of my blog, it's simply that my template currently only lets my post content start to appear after the end of any sidebar material - so including all sponsored material in the sidebar would mean a huge amount of whitespace appearing between the posting date (which does indent correctly for some reason) and the start of the actual post content! If I work out how to fix my blogger template I'll move all the "ads" into my sidebar.
monetization
Friday, 13 October 2006
Financial Information online
The National Information Centre on Retirement Investments (NICRI) has just launched a website full of basic financial advice.
The site provides basic advice, plus calculators to help you see what you can achieve when you start investing or saving.
Six Tools are provided online:
1. Budget Sheet.
2. Assets and Liabilities tables.
3. Needs and Objectives - learn about and prioritise investment objectives.
4. Risk Profile – determine your attitudes towards risk.
5. Choosing Investments – access to information about 30 investment types and investment related topics.
6. Calculators.
personal finance
investing
money
saving
Thursday, 12 October 2006
Tracking my debts on the "No Credit Needed Network"
NCN is an interesting blog that gathers and reports the progress of various bloggers that are attempting to pay down their debts. Most of the participants have student loans and/or credit card balances that wish to eliminate as quickly as possible, but there are also a few reporting on home loan and business loan balances. I thought I may as well track the total quantum of debt I am carrying using this site to keep track of how much I ower and my progress paying off my home loans.
While I have no student loan balance* and pay off my "day-to-day expenses" credit card charges in full each month. I have some other credit card accounts which I recently opened and have taken out 0% balance transfers to invest in an online account and earn some interest on OPM^ [see previous posts link, link, link, and link] . I also have home loans for my house and an investment property which I aim to pay off in 10-15 years. My other main debt is margin loans from several lenders for my Australian and US stock investments, some mutual funds, index funds and hedge fund investments. These are generally "interest only" loans - indeed I generally capitalise a "pre-payment" of 12 months interest at the end of each tax year (to bring forward the tax deduction on the interest) and then pay off the capitalised interest over the following 12 months. I also expect to increase my margin loan balances over time as my stock portfolios appreciate - my aim is to keep the loan-to-value (LVR) ratio of my margin loans at around 50%-60%. As the stocks and funds in my margin loan accounts typically have a margin value of around 70%, this keeps my margin utilisation around 70%-85%. The margin lenders allow you to reach 105% margin utilisation before a margin call will result (when you have to reduce your margin utilisation back below 100%). This allows for an overall drop in the value of my portfolio of around 18% without getting a margin call.
I'll be sending updated figures to NCN each month and posting a link to the updated graph each month.
* In Australia we pay only a portion of the total cost of our studies, known as HECS (higher education contribution scheme). It can be accumulated as a debt to the tax office, and gets automatically paid off via a tax surcharge once your income reaches a threshold level. Alternatively you can pay the HECS "up front" and get a 15% discount on the amount you have to pay. I've always paid my HECS "up front" so I have no debt from my studies.
^ Other peoples money - I love credit card companies lending my their money at 0% for 6 months.
personal finance
money
saving
While I have no student loan balance* and pay off my "day-to-day expenses" credit card charges in full each month. I have some other credit card accounts which I recently opened and have taken out 0% balance transfers to invest in an online account and earn some interest on OPM^ [see previous posts link, link, link, and link] . I also have home loans for my house and an investment property which I aim to pay off in 10-15 years. My other main debt is margin loans from several lenders for my Australian and US stock investments, some mutual funds, index funds and hedge fund investments. These are generally "interest only" loans - indeed I generally capitalise a "pre-payment" of 12 months interest at the end of each tax year (to bring forward the tax deduction on the interest) and then pay off the capitalised interest over the following 12 months. I also expect to increase my margin loan balances over time as my stock portfolios appreciate - my aim is to keep the loan-to-value (LVR) ratio of my margin loans at around 50%-60%. As the stocks and funds in my margin loan accounts typically have a margin value of around 70%, this keeps my margin utilisation around 70%-85%. The margin lenders allow you to reach 105% margin utilisation before a margin call will result (when you have to reduce your margin utilisation back below 100%). This allows for an overall drop in the value of my portfolio of around 18% without getting a margin call.
I'll be sending updated figures to NCN each month and posting a link to the updated graph each month.
Debt info: (Sept)
                                           |- $200,598.09 Investment Property a/c#1
                           |- $348,235.52 --- $258,020.14 Investment Property a/c#2
                           |  (x 0.5)      |- $237,852.82 Home Loan
                           |
           -- $669,719.09 --- $321,483.57 --- $ 36,850.28 SGPL
           |      "good" debt margin loans |- $ 19,325.00 SGML
           |                               |- $ 94,108.28 Comsec
           |                               |- $155,592.50 LE
           |                               |- $ 15,607.51 Citibank
           |
 $673,251.71 --- $3,531.62 ----- $ 15,532.62 -- +$  2,332.38 Cr NAB
            TOTAL  CCARDS     |               |- $ 12,000.00 Virgin
                              |               |- $  5,865.00 Coles
                              |- +$ 12,000.00
                                 invested Cr
Debt info: (Sept)
|- $200,598.09 Investment Property a/c#1
|- $348,235.52 --- $258,020.14 Investment Property a/c#2
| (x 0.5) |- $237,852.82 Home Loan
|
-- $669,719.09 --- $321,483.57 --- $ 36,850.28 SGPL
| "good" debt margin loans |- $ 19,325.00 SGML
| |- $ 94,108.28 Comsec
| |- $155,592.50 LE
| |- $ 15,607.51 Citibank
|
$673,251.71 --- $3,531.62 ----- $ 15,532.62 -- +$ 2,332.38 Cr NAB
TOTAL CCARDS | |- $ 12,000.00 Virgin
| |- $ 5,865.00 Coles
|- +$ 12,000.00
invested Cr
* In Australia we pay only a portion of the total cost of our studies, known as HECS (higher education contribution scheme). It can be accumulated as a debt to the tax office, and gets automatically paid off via a tax surcharge once your income reaches a threshold level. Alternatively you can pay the HECS "up front" and get a 15% discount on the amount you have to pay. I've always paid my HECS "up front" so I have no debt from my studies.
^ Other peoples money - I love credit card companies lending my their money at 0% for 6 months.
personal finance
money
saving
Wednesday, 11 October 2006
Property portfolio update: Oct 06
As mentioned previously, the "estimated value" of my properties dropped back towards more realistic values this month. It's best to view the trend data in a plot of prices over time to spot any such "spikes" or "dips". Nearly every suburb has areas with a few unusually expensive houses (water views or large blocks that can be sub-divided), which push up the median sales price when several of them get sold in a month. Similarly, sales of a new release of "town houses" will push the median sales price down for the month that a development is completed.
Overll the price plot shows that the housing bubble seems to have finished "bursting" in the suburbs where my properties are situated - I now expect that prices will track between the inflation rate (~3%) and the typical long-term rate of house price appreciation (6%) over the next few years.
New housing construction has been below demand for the couple of years (see previous post here), so I expect some upward pressure on prices to appear in 2-4 years time (the start of the next "boom").


This chart from Quartile Property [link] shows the past 25 years of median house prices in Sydney including two market peaks seen in 1989 and late 2003.

Overll the price plot shows that the housing bubble seems to have finished "bursting" in the suburbs where my properties are situated - I now expect that prices will track between the inflation rate (~3%) and the typical long-term rate of house price appreciation (6%) over the next few years.
New housing construction has been below demand for the couple of years (see previous post here), so I expect some upward pressure on prices to appear in 2-4 years time (the start of the next "boom").
This chart from Quartile Property [link] shows the past 25 years of median house prices in Sydney including two market peaks seen in 1989 and late 2003.
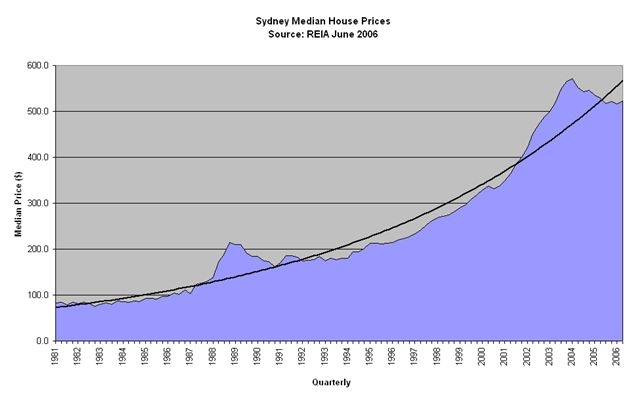
Subscribe to:
Comments (Atom)