
Saturday, 30 September 2006
Goals
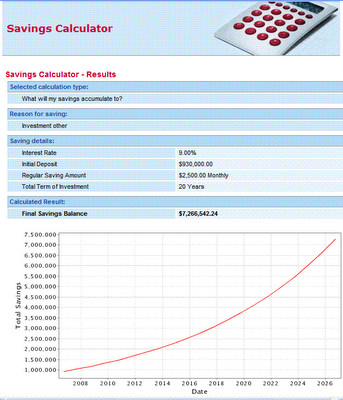
If you want to do a quick "high level" plot of your net worth goal, there are many calculators available on-line, such as this one from National Australia Bank. You just plug in your current net worth, expected annual savings, average investment return and period. It provides a value for each future year, which would be print out and use to check yourself against each year going forward. For more detailed modelling (eg. breakdown by asset class, sensitivity analysis for the expected variability (risk) of returns, annual review of expected vs. actual position) I use an excel spreadsheet. But this is good enough for a "back of the envelope" calculation of your overall goal:
Article of Interest
For all my readers who don't live in Sydey, here is an informative article from today's Sydney Morning Herald: Road to wealth may lie in marching out of step. Nothing revolutionary, but a nice reminder of some of the aspects of behavioural finance that prevent us acting as "rational" investors all the time. The bit about "oversold" (low p/e) stocks ties in with my "Little Book" Investment Portfolio (see previous posts 1, 2)
Friday, 29 September 2006
Personal Finance BlogBook
Here is my "BlogBook" - an enhanced version of the standard blogroll, which will include a ranking/rating indication (IMHO), some info on how frequently each blog is updated, topics covered, and whatever else I think of.
I'll include a permalink to this post at the top of my main blog page, so you can easily find it in future. I'll add and update this post over time.
Personal Finance Blogs:
NOTE: This is a WORK IN PROGRESS. I expect to collate all the real data in the coming week(s) and have set myself a deadline to have this all finalised before the end of October. I'll probably on review/update the info every six months once it's complete - but email me if you feel something is missing or incorrect

AU shares - time to get out of bank stocks?
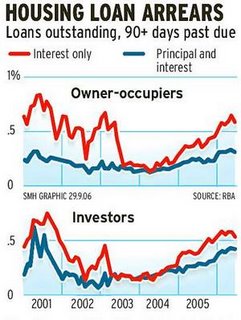
An article in today's Sydney Morning Herald "We of the never-never home loans" highlights the recent rapid increase in the proportion of "interest only" home loans. Traditionally these were mainly used by investors to maximise the effectiveness of negative gearing strategies. But, over the past couple of years homes have become less affordable due to the 1999-2003 housing boom, so more and more home loan borrowers have chosen the lower repayments of an interest only loan to be able to buy a home.
The problem is that a large proportion of these borrowers really can't afford to service the loan, and are a risk of defaulting on loan payments if anything goes wrong.
Banks have been increasingly lending to such "high risk" borrowers in order to maintain their market share and profitability. Despite a couple of periods where stock analysts were advising that bank stocks had peaked, with their profit margins starting to be squeezed, banks have been a consistently good investment over the past decade:
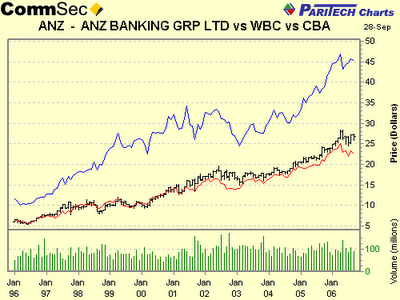
Now, however, I'm thinking seriously about reducing my exposure to bank stocks. The trend in home loan defaults is a bit worrying, and may impact bank profits in the medium term:
Then again, realising capital gains is always a pain in the tax, especially this financial year when my wife is on maternity leave - any extra taxable income could impact her chance of getting any family tax benefit, which means the effective tax rate of realising capital gains this year is prohibitive. Also, as a "long term" investor, trying to dabble in market timing is generally a bad idea.
eenie, meenie, miny, moe...
Disclaimer: I am NOT giving financial advice. Do NOT really on any opinion expressed in this blog when making decisions about YOUR money. Do your own research, seek professional advice as needed. I currently own shares in the following banks: ANZ, CBA, NAB, SUN and WBC.
Thursday, 28 September 2006
Top of the "class"
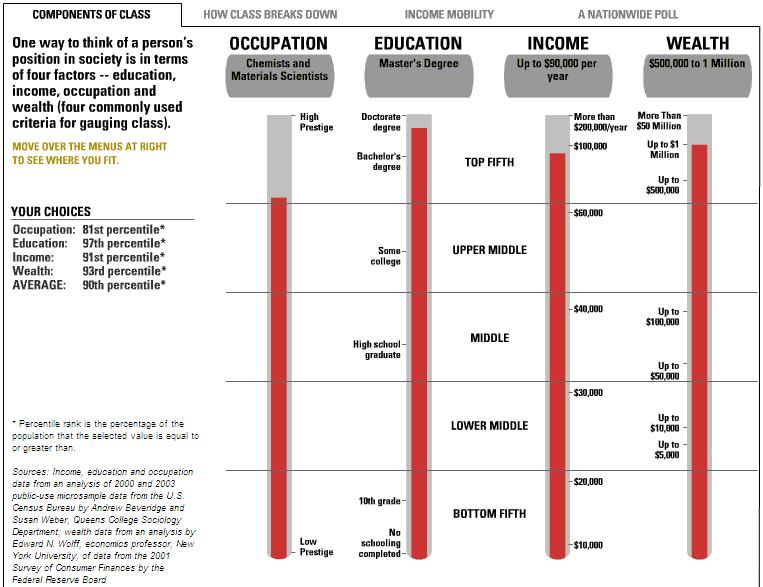
While reading through the archives of the "It's Your Money:Money Musings" blog, I came across this post about class, which relates to an online "class calculator" tool available here from the New York Times. Although it's obviously US-based, the results should be applicable for Australian readers also - although, of course, we Aussies don't have any such thing as a "class system" ;)
Money Musings found his "class" came out as:
  Occupation: 49th Percentile
  Education: 79th Percentile
  Income: 78th Percentile
  Wealth: 55th Percentile
  AVERAGE: 64th Percentile
When I tried it I got:
  Occupation: 81st Percentile
  Education: 97th Percentile
  Income: 91st Percentile
  Wealth: 93rd Percentile
  AVERAGE: 90th Percentile
Which seems pretty much spot on - one of my short term goals is to have a personal net worth that exceeds the 90th percentile household net worth for my age group (using data from the most recent HILDA survey), and, eventually, to exceed 1% of the cut-off the the annual BRW Rich 200 list.
One thing I noticed is that you can influence the outcome by picking the best description of your occupation - as a Chartered Chemist I can hit the 81st Occupation percentile using the "chemists and material scientists" grouping, but if I put in my current occupation (Process Improvement Manager="other business operations specialists") I only rate the 49th percentile!
Another thing to note is that there is no adjustment made for age. As Money Musings says, it is"Difficult to compare the net worth of a 50something with that of a 30something..."
Wednesday, 27 September 2006
Bad advice
Just in case anyone needed any more evidence that most "professionals" giving advice or managing equity investments are just guessing (and sometimes getting lucky), here's an illuminating graph from a recent article in the New York Times' Your Money section. It shows that the number of investment newsletter editors who were recommending a reduction in market exposure corresponded with the arrival of a good "buying opportunity". You can flash this graph at the next financial planner who tries to sell you a managed fund that charges exhorbitant fees based on an ability to "time the market" ;)
ps. The cartoon is also cute.
ps. The cartoon is also cute.
The "Smith Manoeuvre"
Canadian Capitalist has a post about the "Smith Manouevre" - basically just paying off your undeductible home loan as quickly as possible, and simultaneously borrowing to invest in the stock market. Apparently there has been "a fair bit of discussion going on about The Smith Manoeuvre (SM) in Jonathan Chevreau’s columns in The Financial Post and on his Wealthy Boomer Blog"
I wasn't even aware that this basic idea had been given a name! ;)
Canadian Capitalist goes on to say "I doubt that there is a causal link between leveraging and wealth and what wealthy people do after they have accumulated assets is immaterial to the argument.
Personally, I want to keep things simple. Sock away the maximum possible in a RRSP" [retirement account] "and pay down the mortgage with the rest of the savings. The way I see it, I can earn a guaranteed, risk-free, after-tax return of 5.25% (our mortgage interest rate) by paying down the mortgage, which I think is pretty darn good."
I generally like what CC blogs, but I didn't realise he was so conservative an investor. Sensible levels of tax deductible debt to invest via gearing (eg. into a rental property, or diversified stock portfolio) is a well accepted method of improving your investment returns. If you use the extra amount invested to increase your diversification you can even boost your returns without increasing risk (variability of returns).
One thing I that I don't like about gearing is that the interest rates are generally 1-2% higher than those available for investment property loans (which are the same as for a home loan). These days I'm trying to reduce the average interest rate I'm paying for my investment loans, by only adding to my leveraged portfolios with the margin lender that has the lowest rate, and also doing my direct US share investments using funds from a St George Porfolio loan - which is secured against my equity in my home and investment property, so is at the same rate as a home loan.
Gearing can have significantly improve your portfolio performance over time - for example, if an ungeared, diversified portfolio of local and international shares, property, bonds etc. returns as average of 9% pa, you borrow to invest at an interest rate of 8%, and you gear 100% (LVR of 50%), you would improve your ROI from 9% to 10% - over 20 years this would mean a $100,000 portfolio had a final value of $611,000 rather than $514,000 - an improvement of 18%!
What I would like to do one day is compare the average interest rate charged for margin loans (I think it's around 3% above the cash rate, but I'll have to check the current average interest rate vs. cash rate and look at the past 10 years figures to see how consistent this is) vs. the average return on a range of typical portfolios eg. conservative, balanced (cash/bonds/stocks/property), and somewhat aggressive. I suspect gearing is only worthwhile if your risk tolerance allows you to invest aggressively, as the return on a conservative portfolio would probably average less than the interest being charged on a margin loan.
One of the unsung benefits of using gearing is that it provides a means to reduce taxable income (eg. dividends, rental income, wages) by providing a tax deduction for the margin loan interest, and effectively converts this into capital gains which are tax deferred (until the CGT event eg. sale) and ultimately gets taxed at only 50% of your marginal tax rate (if you hold the asset > 12 months). Of course, the main reason for gearing should be to boost your long term ROI, not to reduce your tax bill!
With the recent changes to superannuation taxation, gearing is probably less attractive compared to salary sacrificing into superannuation, but it doesn't have as much legislative/political risk as super.
Personal finance, Money, Investing, Investment, Wealth.
Sunday, 24 September 2006
Your Credit Report
As your credit report can affect your borrowing power, and, at least in the US, what interest rate you are charged, it is important to obtain and check what information the credit agencies have on you.
The NYT had a good article on this topic today, relevant to US readers. Main points are:
* There is only one Web site—www.annualcreditreport.com—where you can either download or order your free reports by phone or mail (the toll-free number is (877) 322-8228).
* You should check your report once a year and correct any errors.
For Australian readers, two main agencies maintain credit databases, and you need to obtain and check the report from each. This will cost a fee(eg. $27 from Baycorp) if you apply online. If you write in and ask for a copy of your details you can get it for free in around 10 days. (They obviously want to make it as hard as possible to make a "free" request.). A form is available online from Baycorp Advantage and Dun and Bradstreet.
There is good information on what's included in your credit reports available from here. The most relevant bit is
"If requested in writing, credit reporting agencies must provide you a report detailing all records on your file. The credit provider must provide a copy of your file within 10 working days of receiving your written request. Section 33 of the South Australian Fair Trading Act 1987 states that this must be provided free of charge to South Australians. If you require a copy urgently, you can request this online or by fax. However, a fee will be charged for this express service."
Most other states have similar legislation, so just write in and ask for a copy of your report from each agency.
Personal finance, Money, Investing, Investment, Wealth.
Saturday, 23 September 2006
100% increase overnight!
Sort of ;)
My wife gave birth to a healthy baby boy yesterday, so our "investment" in children has doubled overnight. This will probably mean fewer posts for a while... though I may do one on the cost of disposable nappies!
My wife gave birth to a healthy baby boy yesterday, so our "investment" in children has doubled overnight. This will probably mean fewer posts for a while... though I may do one on the cost of disposable nappies!
Tuesday, 19 September 2006
AU shares - trading update
Disclaimer: I'm not a financial advisor, so DON'T take anything I write as advice! When I mention specific securities (such as in this post) I obviously have an financial interest in them.
As previously mentioned, most of my investments are in real estate, index funds, or stock funds in my retirement account (superannuation). But I occasionally dabble in trading via the small fraction of my portfolio that is in direct share investments via margin loan accounts. It stops me getting bored and doing something silly with the asset allocation of the major part of my portfolio!
I had bought 2,500 shares of ING Private Equity Access Limited (IPES) when they first were floated as stapled securities for $2.00 each`(15/11/04), and then bought another 1,500 for $1.77 on 11/8/05 .
They stapled securities converted into 2 ordinary shares (IPE) and 1 option (IPEO) to buy an IPE share for $1.00 (option expiry date is 31/10/07) on 7/11/05 for each stapled security. So I ended up with 8,000 IPE shares and 4,000 IPEO options.
After bottoming out around $0.80 per share, IPE has started to trend up in the past few months, now trading around $0.94. So I've just about broken even on the average cost of my holding.
The interesting thing is that the shares are trading for way under the reported NTA value of around $1.20 per share, and the are still 75% invested in a mix of top 100 listed equities, with only a quarter or so of their funds committed to private equitiy investments so far. Even so, the private equity investments made so far have gained around 5% in value, which is a good result considering private equity investments are meant to perform over the longer term.
Of course, listed investment companies usually trade as a discount to NTA, but their price should trend towards the value of the underlying assets in the longer term, and you get a good dividend yield in the meantime. The IPEO options have over a year until expiry, and will be really worth something if the price of IPE gets above $1.00
Based on a few heroic assumptions (guesses), I decided to buy 50,000 IPEO yesterday at $0.039. With Comsec brokerage of $19.95 and the $10.00 margin loan account transaction fee, the total cost of the parcel was $1,979.95 - ie. average cost of IPEO 3.96c
Last time IPE was trading close to $1.00 the options were around 6c- presumably based on the time value of not having to pay the $1.00 execution price until 31 oct 2007. Of course, this "time value" will slowly dissipate between now and 31/10/07 (Slowly at first, then very fast towards the end). If you wanted to try some more precise modelling of the option price over time I think the Black-Scholes equation is available online somewhere (I can't be bothered).
My guess is that the general market could rise 10% or so above it's current level at sometime between now at 31/10/07 - which should push the IPE shares to over $1.06 This should give the options a value upwards of 6c each. Any increase in the price of IPE shares above $1.06 should translate directly into a further gain in the IPEO price. eg. If IPE reached $1.10 by early next year, the options should trade around 12c - 15c each.
Anyhow, worst case is I loose the entire $1,979.95 if the options expire worthless in October 2007. Best case is I'll be deciding next October whether to take a capital gain on the options or pay the $50,000 to invest a significant sum in IPE at $1.00 for the long term...
nb. One thing to note is that IPEO options are VERY thinly traded, so even small trades can impact the pricing. My small trade yesterday was the entire volume for a typical week! And the current buy-sell spread is 34% (a buy quote of 3.3c {45,000 shares} and a sell quote 5c {22,500 shares})
Personal finance, Money, Investing, Investment, Real Estate, Wealth.
Monday, 18 September 2006
Wedding Costs
2million has a post on starting to plan for his wedding - there are a lot of interesting comments about how much is "enough" to spend on a great wedding ("perfect" weddings don't exist in reality, and planning for them costs a fortune).
I put in my two cents worth on how to plan an affordable wedding that still provides priceless memories (and not too much stress for everyone):
As my wife's parent were both deceased, I (and my parents) paid for our wedding. We did it "on the cheap", but it was still very nice - and I used the money we saved to splurge on a "round the world, New York , London and Paris (with QEII from NY to the UK)" honeymoon ;)
We spent a few enjoyable weekends driving around Sydney looking for a church with the right "atmosphere", did up our own wedding invitations using some nice paper, an inkjet printer and a sketch of the church the minister gave us. The biggest saving was to do the reception as an "afternoon tea" at my parent's house, which was possible because we only invited very best friends and our relatives (we don't have many living here in Australia anyhow), so we only had around 30 guests. We also got a couple of standard cakes with suitable icing from a local bakery and staked them up to construct a wedding cake - "real" wedding cakes cost a fortune and are practically inedible. It looks fantastic on the wedding photos.
We also got several of the relatives to take photos, videos etc. and got copies of everything. Unless you're planning on sending your footage to "funniest home videos" you don't need a "professional" photographer (most are pretty average anyhow).
The wife borrowed her wedding dress from one of her best friends, and my sister made up a veil and other bits and pieces which made nice keepsakes . (You intend to keep the dress and the wedding cake forever? Sounds like "Great Expectations")
Anyhow, you should discuss this option with your fiancee (doing a "home made" wedding rather than the "crass, commercialised" version) and see what she says. You never know till you ask.
Saturday, 16 September 2006
Rental Property Blues
Our rental property has been vacant for 1-1/2 weeks now. Hopefully the real estate agent will get us a new tenant before too long - it's alarming how quickly the balance in our joint bank account drops with the fortnightly loan payments coming out (our home + rental property) if there's only the money going in from me and the missus, and no rent. We had a really good tenant for the first 5 years after we bought the property in 2000, but the most recent tenant was only on a 6-months lease, and as soon as the lease expired they moved to a slightly better (and more expensive) house in the same suburb. I'd like the next tenant to sign a 12-month lease as we could do with some certainty of income - the wife started her maternity leave last week (offspring #2 is due in the next week or two), so we'll be using up the prepayments we had accumulated to make our home loan payments over the coming year.
The property has been advertised for three weeks, and there've been some inspections by prospective tenants, but no takers so far. It shouldn't be too hard to rent out though, as vacancy rates have been dropping for the past year and our rental is in the bottom 25% for the suburb. We set the initial rent at the bottom end of what the agent had recommended, and I now just do an annual rent review based on the rent statistics published each quarter in the NSW Rent & Sales Report. I plot our rent vs. the average to check when an increase is justified:

The property has been advertised for three weeks, and there've been some inspections by prospective tenants, but no takers so far. It shouldn't be too hard to rent out though, as vacancy rates have been dropping for the past year and our rental is in the bottom 25% for the suburb. We set the initial rent at the bottom end of what the agent had recommended, and I now just do an annual rent review based on the rent statistics published each quarter in the NSW Rent & Sales Report. I plot our rent vs. the average to check when an increase is justified:
Thursday, 14 September 2006
Boosting your savings painlessly (for wage slaves)
Vanguard Australia had an interesting article last week describing a savings technique that I've been using myself for several years to painlessly boost retirement savings. The basic idea is to increase your savings by a tiny percentage each year - doing it so gradually that you never notice the extra amount you're putting away. That way you don't miss what you've never had (in terms of disposable cash flow), so it's entirely "painless".
I increase my savings rate each June by a fraction of what I expect my pay rise to be for the coming year - arranging to increase my payroll deduction into Superannuation via Salary Sacrifice before the pay rise comes into effect.
Incidentally, savings via a superannuation (retirement) account will get an even bigger tax concession from 1 July 2007 with the move to reduce the rate of tax on end benefits to 0%. So, if you're taxable income is more than $25,000 pa contributing via salary sacrifice means paying 15% contribution tax rather than 30%, and from next July there'll be no tax on your retirement income stream from superannuation. The savings are of course even more worthwhile for higher income earners on a higher marginal tax rate.
A couple of things to watch out for:
* maximum pre-tax contributions from 1/7/2007 are expected to be $50,000 per annum, and this includes the 9% Superannuation Guarantee Levy amount your employer already contributes. But this would only affect very high income earners!
A couple of things to watch out for:
* maximum pre-tax contributions from 1/7/2007 are expected to be $50,000 per annum, and this includes the 9% Superannuation Guarantee Levy amount your employer already contributes. But this would only affect very high income earners!
* another $150,000 per year can also be contributed as an undeducted contribution. So it may be worthwhile moving some existing savings into your superannuation account. However, this strategy wouldn't be suitable for your "emergency" fund, as super can't normally be withdrawn until you reach retirement age. There's also a risk that the rules could change again before you withdraw the funds during retirement!
* check that your employer won't reduce the SGL amount they contribute if you salary sacrifice - the SGL amount should be based on your nominal salary, rather than the reduced amount left after deducting the salary sacrifice. Most employers are fine with this (they should be - salary sacrifice actually saves them money by cutting the amount of payroll tax they have to pay!) but technically they only have to pay SGL based on your wage.
Marginal Tax rates 2006-07
(nb. these rates don't include the 1.5% medicare levy)
I was sacrificing 9.8% of my salary last year, and this year used my pay rise to increase it to 12.7%. Due to getting a small (3%) pay rise and the cut in income tax rates, I still ended up with a few dollars a week more in my pay packet - enough to cover the increased petrol prices at least. From now until I retire (approx. 20 years) this will mean around $50,000 extra going into my super account. This should add around $75,000 to my superannuation balance at retirement!
ps. For lower income earners (<$30,000) it's important to still make a $1000 "after tax" contribution so that you get the free money (co-contribution) on offer from the government. You can probably do this via B-Pay straight from your bank into your superannuation account, and the tax office will automatically determine your eligibility and arrange for the co-contribution when you lodge your tax return. For those earning between $30,000-$50,000 the co-contribution phases out. You still get $1.50 from the government for every $1 you contribute, but the maximum amount reduces, so you should contribute less than $1,000 if you earn >$30,000. eg. If you earn $40,000 you'd get the maximum $900 co-contribution if you made a $600 "after tax" (undeducted) contribution. The ATO has a simple
calculator available on their website. It's funny to note that a lot of the financial press regularly gets this wrong - suggesting that you still have to make a $1,000 contribution to get the maximum available co-contribution, even if you earn over $40,000!
* check that your employer won't reduce the SGL amount they contribute if you salary sacrifice - the SGL amount should be based on your nominal salary, rather than the reduced amount left after deducting the salary sacrifice. Most employers are fine with this (they should be - salary sacrifice actually saves them money by cutting the amount of payroll tax they have to pay!) but technically they only have to pay SGL based on your wage.
Marginal Tax rates 2006-07
Taxable                      Marginal      Tax Saved by using
Income                       Tax rate      Salary Sacrifice
$0 – $6,000                   Nil           not a good idea!
$6,001 – $25,000              15%           nothing up front, but the savings in super are tax sheltered.
$25,001 - $75,000            30%           15%
$75,001 –- $150,000           40%           25%
Over $150,000                45%           30%
(nb. these rates don't include the 1.5% medicare levy)
I was sacrificing 9.8% of my salary last year, and this year used my pay rise to increase it to 12.7%. Due to getting a small (3%) pay rise and the cut in income tax rates, I still ended up with a few dollars a week more in my pay packet - enough to cover the increased petrol prices at least. From now until I retire (approx. 20 years) this will mean around $50,000 extra going into my super account. This should add around $75,000 to my superannuation balance at retirement!
ps. For lower income earners (<$30,000) it's important to still make a $1000 "after tax" contribution so that you get the free money (co-contribution) on offer from the government. You can probably do this via B-Pay straight from your bank into your superannuation account, and the tax office will automatically determine your eligibility and arrange for the co-contribution when you lodge your tax return. For those earning between $30,000-$50,000 the co-contribution phases out. You still get $1.50 from the government for every $1 you contribute, but the maximum amount reduces, so you should contribute less than $1,000 if you earn >$30,000. eg. If you earn $40,000 you'd get the maximum $900 co-contribution if you made a $600 "after tax" (undeducted) contribution. The ATO has a simple
calculator available on their website. It's funny to note that a lot of the financial press regularly gets this wrong - suggesting that you still have to make a $1,000 contribution to get the maximum available co-contribution, even if you earn over $40,000!
Tuesday, 12 September 2006
"Little Book" Portfolio Snapshot
Here's the first snapshot of how my "Little Book that Beats the Market" Portfolio (hereafter to be known as the "LBP") is tracking so far. I'll post and update every month:

Highlights of my LBP Plan:


Highlights of my LBP Plan:
* 100% geared using Portfolio loan secured against real estate equity
[loan interest rate currently approx. 7.25%]
[loan interest rate currently approx. 7.25%]
* LBP performance target 15% pa [net of costs] over medium-long term [5-20 years]
* invest in monthly $5000USD lots (~$7000AUD) over an 18 month period
* pick one stock each month using the "Little Book" website list of prospects
[using filter criteria of >$127m market cap, and list 100 to pick from]
* stocks purchased using Comsec Pershing US brokerage facility
* stocks purchased using Comsec Pershing US brokerage facility
* sell each stock after 18 months, and buy a replacement using the realised funds
* fund interest payments on loan from my cashflow and any dividends received
Monday, 11 September 2006
"Little Book" Investing down under
I read "The Little Book that beats the market" while I was browsing through a bookshop several weeks ago. The author, Joel Greenblatt, is a Columbia Business School adjunct professor, and in this book he proposes that investors can achieve better than "market average" returns using a "value" approach to investing. It's an entertaining read, but I don't really think you need to buy the book unless you want it on your bookshelf - a quick skim through gives you the basic theory behind his approach to stock picking, and the data required to apply it yourself to Australian stocks isn't readily available (as far as I know), and everything you need for US stock picking is provided on a free website (see below). However, if you want to buy a copy for your investment library (or to wave around at dinner parties once you've made a million trading this system), amazon.com has it for about $13US (nb. if you use this link I'll get a 4% commision):
If you've read it in the local library (or bookshop) there is a website (magicformulainvesting.com) that conveniently provides you with lists of suitable US stocks that rank highly under his system. The data is apparently updated daily, so any time you want to pick a stock using his method you just log in, enter a couple of criteria (minimum market capitalisation and how many stocks to list), and voila - you are ready to take the plunge.
Over the years I've drifted into the semi-strong efficient market camp, and so I nowadays invest in Vanguard Index Funds as the "core" of my portfolio, but I still like to dabble in direct investments to add interest (and, if I'm lucky, some performance) to my stock portfolio. I wanted to start adding some direct investments in US equities to my portfolio this year, so when I read this book I decided to take the plunge into direct US share investing using this system to select stocks. The main adjustments required are to ensure that you hold each stock for more than twelve months so you get the 50% capital gains tax discount (in Australia), and to buy fewer than the 30 stocks he recommends to reduce trading costs. I intend to buy a stock each month and hold each of my stocks for 18 months so that my "churn" is reduced a bit. My total US portfolio will thus end up containing 18 stocks - enough diversification to achieve whatever performance this system can yield. The book advises selling each stock after 12 months, but buying US stocks through Comsec (via the US broker Pershing) costs $65US each way, which is a LOT more than the $5US trades available in the States. I'm buying a $5,000US lot each month, which means that my round trip cost per lot will be around $130US ie. 2.6% - or about 1.75% per annum. As Vanguard International Index Funds will cost around 0.75% per annum, you have to outperform the market by at least 1% to match simple indexing.
Prof. Greenblatt's private investment partnership, Gotham Capital, is supposed to have produced 40 per cent a year returns over the past 20 years. My "target" is to achieve 15% per annum return (after trading costs). I am borrowing 100% of the amount I am investing using part of a Portfolio Loan (line of credit) I have from St George bank. This has the same interest rate as our property loans (currently around 7%), so if everything goes well I'd achieve around 8% return using OPM (other people's money). Of course, if things don't work our I'll lose money hand over fist ;). As my total investment will end up around $90,000 US ($120,000 AUD) I expect the worst case would be around $36,000 loss (interest payments and capital if the investments average a 20% loss) - around 5% of my net worth. nb. Back-testing his formula between 1988 and 2004, Greenblatt only had one down year, with the magic portfolio returning 30.8 per cent a year, against a 12.4 percent annual return for the S&P 500. It wasn't clear whether the back testing used random selections of 30 stocks picked from the universe of stocks thrown up by the magic formula - I'll be just picking one from the list each month that catches my eye.
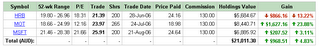
I've been using this system now for three months, having bought H & R Block (HRB), Motorola (MOT) and Microsoft (MSFT) so far. HRB has gone down since I bought it, MOT and MSFT up, so overall I'm up about 3% after round trip costs - I'll post a detailed update on how this portfolio is going each month... wish me luck!
If you've read it in the local library (or bookshop) there is a website (magicformulainvesting.com) that conveniently provides you with lists of suitable US stocks that rank highly under his system. The data is apparently updated daily, so any time you want to pick a stock using his method you just log in, enter a couple of criteria (minimum market capitalisation and how many stocks to list), and voila - you are ready to take the plunge.
Over the years I've drifted into the semi-strong efficient market camp, and so I nowadays invest in Vanguard Index Funds as the "core" of my portfolio, but I still like to dabble in direct investments to add interest (and, if I'm lucky, some performance) to my stock portfolio. I wanted to start adding some direct investments in US equities to my portfolio this year, so when I read this book I decided to take the plunge into direct US share investing using this system to select stocks. The main adjustments required are to ensure that you hold each stock for more than twelve months so you get the 50% capital gains tax discount (in Australia), and to buy fewer than the 30 stocks he recommends to reduce trading costs. I intend to buy a stock each month and hold each of my stocks for 18 months so that my "churn" is reduced a bit. My total US portfolio will thus end up containing 18 stocks - enough diversification to achieve whatever performance this system can yield. The book advises selling each stock after 12 months, but buying US stocks through Comsec (via the US broker Pershing) costs $65US each way, which is a LOT more than the $5US trades available in the States. I'm buying a $5,000US lot each month, which means that my round trip cost per lot will be around $130US ie. 2.6% - or about 1.75% per annum. As Vanguard International Index Funds will cost around 0.75% per annum, you have to outperform the market by at least 1% to match simple indexing.
Prof. Greenblatt's private investment partnership, Gotham Capital, is supposed to have produced 40 per cent a year returns over the past 20 years. My "target" is to achieve 15% per annum return (after trading costs). I am borrowing 100% of the amount I am investing using part of a Portfolio Loan (line of credit) I have from St George bank. This has the same interest rate as our property loans (currently around 7%), so if everything goes well I'd achieve around 8% return using OPM (other people's money). Of course, if things don't work our I'll lose money hand over fist ;). As my total investment will end up around $90,000 US ($120,000 AUD) I expect the worst case would be around $36,000 loss (interest payments and capital if the investments average a 20% loss) - around 5% of my net worth. nb. Back-testing his formula between 1988 and 2004, Greenblatt only had one down year, with the magic portfolio returning 30.8 per cent a year, against a 12.4 percent annual return for the S&P 500. It wasn't clear whether the back testing used random selections of 30 stocks picked from the universe of stocks thrown up by the magic formula - I'll be just picking one from the list each month that catches my eye.
I've been using this system now for three months, having bought H & R Block (HRB), Motorola (MOT) and Microsoft (MSFT) so far. HRB has gone down since I bought it, MOT and MSFT up, so overall I'm up about 3% after round trip costs - I'll post a detailed update on how this portfolio is going each month... wish me luck!
Sunday, 10 September 2006
Estimating Net Worth - Real Estate
I have quite a lot of real estate assets - they actually make up a larger percentage of my portfolio than I'd really like (due my wife and I starting out buying a rental property while living with my parents, then later on buying our own place). As they form such a large part of my investment portfolio, I like to be able to update the relevant asset and liability values each month, so that my net worth figure is a reasonable estimate.
The land valuations available via the council rates notices or annual state government land tax calculation are not really much use, as they are based on land value only, and are also only updated on a multi-year cycle.
My method for getting a reasonable monthly figure is to use the bank mortgage statement for the outstanding loan balance at the end of each month, and a simple algorithm for estimating the current valuation of each property. The algorithm is based on the MEAN value of sales in the relevant postcode area (obtained each month from the "suburb snapshot" available by postcode area on the homepriceguide.com.au website for example,2086). I use a simple multiple of the mean price, based on the ratio that applied when I initially purchased the property. For example, my rental property cost 0.9156 x the mean price for the area, so each month I estimate the current valuation as 0.9156 x the latest mean price value.
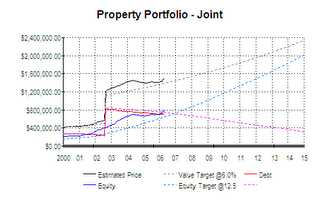
This allows me to update both house prices and loan balances, and track my progress against what I expected for my property portfolio - paying off the loans over 20 years and property values increasing by approx. 6% per annum in the long run:
 It is interesting to also track the percentage change in prices each month, as this clearly shows the "boom & bust" of the Sydney property cycle - as it applies to the specific areas where my properties are.

The land valuations available via the council rates notices or annual state government land tax calculation are not really much use, as they are based on land value only, and are also only updated on a multi-year cycle.
My method for getting a reasonable monthly figure is to use the bank mortgage statement for the outstanding loan balance at the end of each month, and a simple algorithm for estimating the current valuation of each property. The algorithm is based on the MEAN value of sales in the relevant postcode area (obtained each month from the "suburb snapshot" available by postcode area on the homepriceguide.com.au website for example,2086). I use a simple multiple of the mean price, based on the ratio that applied when I initially purchased the property. For example, my rental property cost 0.9156 x the mean price for the area, so each month I estimate the current valuation as 0.9156 x the latest mean price value.
This allows me to update both house prices and loan balances, and track my progress against what I expected for my property portfolio - paying off the loans over 20 years and property values increasing by approx. 6% per annum in the long run:
 It is interesting to also track the percentage change in prices each month, as this clearly shows the "boom & bust" of the Sydney property cycle - as it applies to the specific areas where my properties are.
Thursday, 7 September 2006
Super Fund Managers are NOT our friends
Let's face it. Superannuation is a business, and Fund managers want to make as much profit as possible - by taking as big a cut as possible out of our money!
A typical example was the response to the Treasurer's proposed cut in Superannuation tax (to 0%) on end benefits. After an initial "any cut in superannuation tax is wonderful" reaction from the Funds (because it will encourage more money to flow into superannuation instead of other investments, and hence generate more fee income for them). It quickly became a unified call from the Fund managers to "cut the tax on money going IN to superannuation instead". Allegedly this will mean bigger end benefits for members, but the only detailed analysis of this I've seen showed that the difference between eliminating tax on end benefits compared to eliminating it from contributions is minimal.
The REAL reason (that no one has mentioned) is that a cut in tax on end benefits doesn't directly increase Super Fund profits, all else being equal (ie. ignoring any increase due to increased contributions into Superannation). On the other hand, eliminating the 15% contribution tax means that super funds will get an immediate 15% increase in the amount of fees they collect on contributions! And the bucket of money sitting in your retirement account (and subject to a typical 2% MER) would get 15% larger over time.
Funny that none of the Fund managers seem to have pointed that out, or have offered to cut their fees if the tax cut was applied to contributions instead of end benefits!
Personal finance, Money, Investing, Investment, Real Estate, Wealth.
Tuesday, 5 September 2006
How much do I save?
Reading a post on Canadian Capitalist's blog about how much he saves started me thinking about how much I'm actually saving these days. Beyond a glib "as much as possible" it's actually not that easy to work out, as the use of gearing can complicate things.
It's easy enough to break down my standard home loan payments into a saving (principal repayments) and an expense (interest) component, and the same used to apply to my investment property loan. But nowadays we've switched the rental property loan to interest only, and the extra payments that used to help reduce the loan prinicpal (ie. were counted as "savings") are now being used to pay the interest (an "expense") on loans used for 100% geared investments in US shares (via a Portfolio Loan line of credit from St George) and an investment in the Macquarie Equinox Select Opportunities Trust (funded entirely by a loan from Macquarie Bank).
So, even though my income has hardly changed (a very slight increase in dividend income from the US shares and 1% interest income from the Equinox trust) more of my cash flow is now going into interest payments (an expense) than into reducing debt (savings). So it appears my savings rate has decreased, even though I'm not spending any more than before on consumption and household expenses.
Similarly, the bit of dividend income that is getting reinvested (via a DRP) is counted as "savings", but I don't think share purchases made using an increased margin loan balance can be counted as "savings", as this increase in assets is totally offset by an equivalent amount of increased debt (ie. there is no change in net worth when the purchase is made).
The dividends received add to my total income, and the interest on the margin loan is an expense, but using reasonably high levels of gearing the interest expenses generally exceed the dividend income - ie. negative gearing. While the main goals of using gearing are to increase the returns and diversification of my investment portfolio, it also has the effect of reducing my taxable income and replacing it with (hopefully) some long-term capital gains. But from a savings point of view it is simply converting one form of expense (taxes) into another (loan interest).
This is why the use of gearing makes any meaningful calculation of percentage of income being saved very difficult, and make it meaningless to compare the "savings rate" of investors using gearing with other investors that save without any gearing.
The best approximation I can come up with for FY 05/06 is:
nb. The tax figure is low as it is based on income tax assessed last FY as a proportion of my grossed up income, ie. before deductions such as superanuation (SGL and salary sacrifice) and margin loan interest. It also doesn't include any GST, fuel taxes etc.
It's easy enough to break down my standard home loan payments into a saving (principal repayments) and an expense (interest) component, and the same used to apply to my investment property loan. But nowadays we've switched the rental property loan to interest only, and the extra payments that used to help reduce the loan prinicpal (ie. were counted as "savings") are now being used to pay the interest (an "expense") on loans used for 100% geared investments in US shares (via a Portfolio Loan line of credit from St George) and an investment in the Macquarie Equinox Select Opportunities Trust (funded entirely by a loan from Macquarie Bank).
So, even though my income has hardly changed (a very slight increase in dividend income from the US shares and 1% interest income from the Equinox trust) more of my cash flow is now going into interest payments (an expense) than into reducing debt (savings). So it appears my savings rate has decreased, even though I'm not spending any more than before on consumption and household expenses.
Similarly, the bit of dividend income that is getting reinvested (via a DRP) is counted as "savings", but I don't think share purchases made using an increased margin loan balance can be counted as "savings", as this increase in assets is totally offset by an equivalent amount of increased debt (ie. there is no change in net worth when the purchase is made).
The dividends received add to my total income, and the interest on the margin loan is an expense, but using reasonably high levels of gearing the interest expenses generally exceed the dividend income - ie. negative gearing. While the main goals of using gearing are to increase the returns and diversification of my investment portfolio, it also has the effect of reducing my taxable income and replacing it with (hopefully) some long-term capital gains. But from a savings point of view it is simply converting one form of expense (taxes) into another (loan interest).
This is why the use of gearing makes any meaningful calculation of percentage of income being saved very difficult, and make it meaningless to compare the "savings rate" of investors using gearing with other investors that save without any gearing.
The best approximation I can come up with for FY 05/06 is:
Savings -              32%
Taxes -                 9%
Mortgage Interest -    21%
Investment Interest -  21%
Other -                17%
nb. The tax figure is low as it is based on income tax assessed last FY as a proportion of my grossed up income, ie. before deductions such as superanuation (SGL and salary sacrifice) and margin loan interest. It also doesn't include any GST, fuel taxes etc.
Personal finance, Money, Investing, Investment, Real Estate, Wealth.
Friday, 1 September 2006
Margin Lender comparison
If you want to boost your investment returns, are comfortable taking on increased risk, have adequate resources to ride out any market downturns, and are investing for the long haul, then perhaps gearing is for you. Then again, maybe not. Reminder: This Blog is NOT financial advice ;)
The concept of margin lending is pretty simple - you buy some shares of mutual funds using some of your own money plus some money borrowed from a margin lender. Each share and fund is assigned a margin, which is the maximum percentage that will be lent against that security. Once you have a few securities in your margin lending account, the overall margin of the account determines how much your total loan can be. The "margin value" of your account goes up and down with the prices of the securities, so if you borrow close to the maximum and the market tanks, you'll get the dreaded "margin call" - which means that you have to bring your loan balance back within bounds. This can be done by adding in some more funds or securities, or selling some of the securities in your account. So it's a good idea to be conservative in your use of gearing (eg. use only 50% when the limit is 70%) and to have some funds to draw on in a real crash(eg. some redraw available from your home loan account). [One of the most infuriating features about using gearing is that when the market crashes and you keep your nerve and are dying to pick up some "bargains" is exactly when you're most likely to hit your margin limit and can't afford to borrow any more!]
Over the years I have moved my mutual fund and direct shares investments into margin loan accounts with three providers - Leveraged Equities, Comsec and St George Margin Lending. Although the basic product is similar, there are differences that set them apart and can be important.
A general comparison of available margin lenders can be found on infochoice.
I started out with ungeared share investments, then transferred my holdings into a margin lending account with Leveraged Equities. They have been around longer than most, and nowadays are owned by Adelaide Bank - not that they offer any sort of guarantee! Leveraged equities has a minimum loan balance of $20,000 - you can start off with less, but you'll still pay interest on $20,000.
Pros: They have an default loan limit of $1,000,000 but you don't have to get approval for a specific amount and they don't need your income details. They really do secure the loan only against the underlying securities (but you'd still owe them the balance if a market crash left you with no equity). This is different from Comsec and St George which have to approve a particular limit, based on your income ad other assets and debts when you apply. You then have to apply if you need an increased limit later on. Another nice feature is that you can transfer funds easily to and from your nominated bank account and the margin loan account. This can be handy if you want to borrow funds to invest in some other investment eg. An agricultual scheme. Beware: if you used the funds for something else (eg. paying off your car loan) the interest on that part of the loan balance wouldn't be tax deductible, which would make the paper work way too hard.
Cons: You can't trade directly, online - you have a broker linked to your margin account and trade through them. This means you have to trade by phone and tell your broker that the trade is on your margin account. Also, the interest rate is generally a bit higher than some other lenders.
Comsec: My second margin lender. I opened this account as you CAN trade on your Comsec Margin account via the internet, which is cheaper and, for me at least, is less hassle.
Cons: One feature I hate is that you have to have separate accounts if you want to trade options or overseas shares. In an ideal world you could do it all within the one account - they'd just assign zero margin limit to such securities. They also charge a $10 "transfer fee" to settle your online trades via the margin account, which seems a real ripoff as you are making the trade online from within the margin account! It makes the online trades less economical for small parcels.
Pros: You have your loan details, contract notes and access to research all within the one online account.
St George: Similar to Comsec, but, as a "Gold" customer (due to having my home loans with them) I can get a small discount off the standard margin loan interest rate. But you have to ask for it, the margin lending group seems to work quite independently of the rest of the bank. eg. Your margin loan doesn't appear with your other accounts when you do internet banking with St George. This seems a bit strange, especially when you have a "Portfolio Loan" with the bank.
Cons: As with Leveraged Equities, you have to trade via your broker, which is not ideal. You also get assigned a set loan limit when you open the account, so you have to apply if you want to increase the limit later on.
All three margin lenders have lists of "approved" securites that they'll lend against, and may differ in the margin limit assigned to each security. This may matter if you already have some shares you want to lodge as security. Their interest rates differ a little bit, with the banks usually a bit cheaper on the variable rate compared to LE. You can prepay the interest on a portion of your loan balance (up to 12 months in advance is tax deductible at the date it is paid) - the rates on offer can differ quite a lot, so it pays to compare rates.
Some drawbacks of having multiple margin accounts:
* The holdings are each under a separate HIN, so if you have the same secuity in two accounts you'll get two dividend payments, annual reports and so on.
* The margin utilisation is calculated individually for each account, and it's not practical to shift funds from one lenders account to another.
* You get multiple monthly statements, and have a bit more paperwork at tax time.
As their are no account keeping fees there's really no cost in using more than one margin lender.
Subscribe to:
Posts (Atom)