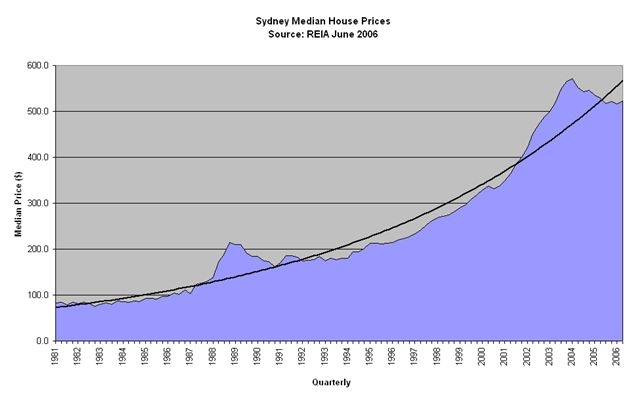
Overll the price plot shows that the housing bubble seems to have finished "bursting" in the suburbs where my properties are situated - I now expect that prices will track between the inflation rate (~3%) and the typical long-term rate of house price appreciation (6%) over the next few years.
New housing construction has been below demand for the couple of years (see previous post here), so I expect some upward pressure on prices to appear in 2-4 years time (the start of the next "boom").
This chart from Quartile Property [link] shows the past 25 years of median house prices in Sydney including two market peaks seen in 1989 and late 2003.
No comments:
Post a Comment