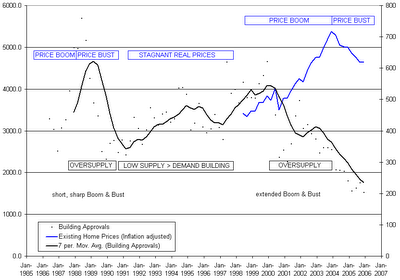
Picking the bottom of the cycle is easier if we use objective data to plot the cycle and see where we are. The data needed are monthly median house prices, an adjustment for inflation (CPI data), and Quarterly building approvals. As an example here is such data plotted for the Sydney residential property market:

The housing boom of 1998 was very sharp, triggered by the stock market crash of '87. House prices in Sydney doubled in a couple of years, and then stagnated through the '90s.
The boom in 1999-2003 was longer, and had a slight "pause" mid-way through before gathering pace again. As repayments are more sensitive to interest rates than house prices, the lower interest rate environment of the late '90s helped prices reach a higher level in real terms and as a multiple of average weekly wage than in previous cycles.
The current slump in house prices appears to have now bottomed out, and, based on the very low level of housing construction, could start to pick up again sooner than many people think. Although house prices in Sydney are still high relative to the average wage, more home buyers are dual income families, and so can better afford higher repayments. The shortage of land available for development (based on Sydney's geography and lack of state government spending on infrastructure) could easily spark another round of price increases when interest rates start to trend down again.
* Fred & Brett Johnson own the property investment company "Quartile Property Network" which has been investing in Sydney real estate since 1953.
No comments:
Post a Comment