A Simple Financial Lifecycle Illustrator that you can play around with.
All figures are in current $ terms.
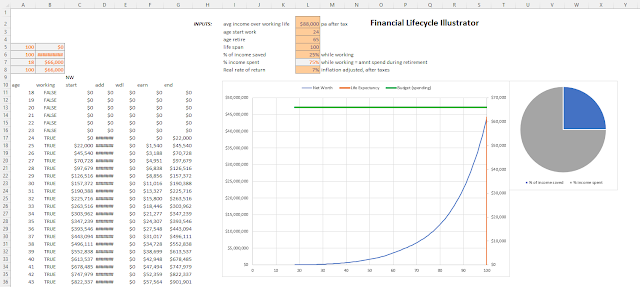
Enter the average after tax (take home) salary, age start and end full time employment, percentage of salary saved. It is assumed that all savings are available for retirement income, and that the amount of take home - savings = budget (both while working and during retirement). Then enter the inflation-adjusted after-tax rate of return (eg. If invested in index stock funds within superannuation, where the tax rate is 15% and the inflation rate was 2%, then an average return of 11% becomes 9% after adjusting for inflation, and 7.65% after tax).
Playing around with it lets you see the impact of changes to savings rate, retirement age, asset allocation (ie expected average return) and so on. It is a very simplistic model, as assumes the entered values are the average for the entire timeframe and doesn't allow for sequencing risk of any variability, periods spent working part-time etc.
Subscribe to Enough Wealth. Copyright 2006-2023
No comments:
Post a Comment